Capital Management –
Financial and manufactured capital
OUR FINANCIAL CAPITAL COMPRISES OF FUNDS THAT WE USE TO INVEST IN OUR BUSINESS WHILST MANUFACTURED CAPITAL COMPRISES THE CAPITAL GOODS STOCK BUILT BY THE BANK.
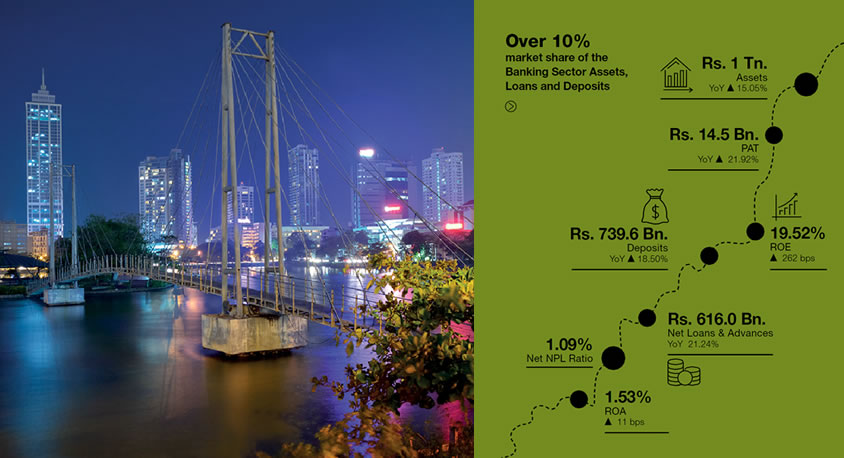
2016 IS A LANDMARK YEAR AS WE WERE THE FIRST PRIVATE BANK TO EXCEED MILESToNES OF RS. 1 TN. ASSETS AND RS. 100 BN. REGULATORY CAPITAL.
A CLEAR TESTIMONY OF HOW PRUDENTLY WE HAVE UTILISED OUR RESOURCES TO DELIVER VALUE TO SHAREHOLDERS.
Financial Review
2016 has been a spectacular year for the Bank in which we witnessed doubling of the total Assets, Loans & Advances and Deposits of the Bank over past five years, outpacing industry growth…
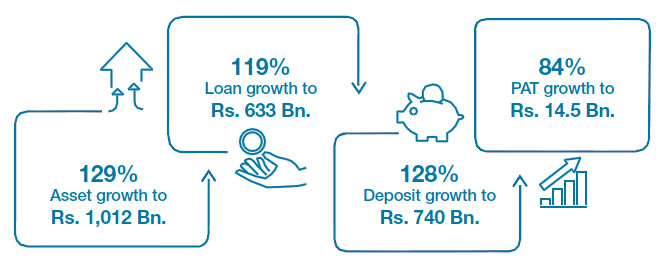
Figure 7
Our journey for 2016 began with a strategy focussed on volume growth and target marketing to lucrative segments within the Sri Lankan economy, such as SME, industrial and housing sectors, whilst also leveraging on the growth of convenience and online banking concepts. Despite highly volatile margins, the hike in interest rates and dampened credit demand towards the latter part in 2016, we witnessed our net loan portfolio growing by 21.24% YoY, higher than the five year CAGR of 16.56%, whilst improving the loan quality through lower NPLs with actual NPLs recording a negative growth in absolute terms for the second consecutive year.
ROE increased to 19.52% in 2016, from 16.90% a year ago, which is higher than the five year average of 18.56%. Growth in loan portfolio, higher interest and non-interest income and lower impairment charges supported growth albeit declining NIMs consequent to increased cost of funds driven by strong growth witnessed in time deposits.
Income Statement Analysis
Net Interest Income
The Gross income of the Bank improved by a noteworthy Rs. 15.275 Bn. or 19.62% to Rs. 93.143 Bn. helped by a strong contribution from core banking activities with increased business volumes, which boosted the interest income to Rs. 80.738 Bn. with a commendable YoY growth of 22.27%.
NII growth was supported by growth in loans and advances, rising interest rates and strategic rebalancing of the asset portfolio, despite the narrowing net interest margins. The ceiling imposed by the CBSL on credit card business and personal lending tempered the overall impact of rising interest rates, together with increased price competition. NIM and the CASA ratio declined from 3.62% and 49.70% in 2015 to 3.47% and 41.67% in 2016 respectively as customers moved from savings to high yielding term deposits as the interest difference between the two products increased.
Fee and Commission Income
Net Fee and Commission Income was Rs. 7.016 Bn., reflecting an increase of 30.54%, as we strengthened our leading market share in trade finance through strategic initiatives to increase customer convenience. Rapid growth in credit and debit cards issued and utilised, also supported fee and commission income growth broad basing our sources of fee based income. Leveraging networks for growth in our card portfolio is also expected to further strengthen earnings from Fee and Commission Income, while plans by the CBSL for issuing a local card are expected to stabilise margins while increasing penetration of the product.
Total Operating Income
Operating income of Rs. 44.101 Bn. reflects healthy growth of fund based and fee-based income, moderated mainly by mark to market losses on FX swaps transactions during the year (Graph 8). Other Income of Rs. 5.617 Bn., comprises recoveries of loans written off and provision reversals amounting to Rs. 1.590 Bn. and exchange profit including gains on revaluation on foreign exchange of Rs. 3.755 Bn. Composition of total operating income reflects stability in earnings with NII and Net Fees and Commission Income accounting for 74.43% and 15.91% respectively, with volatile elements curtailed to a relatively narrow band consistently over the long-term.
Graph 8
Impairment Charges
Impairment charges were Rs. 1.530 Bn., reflecting a decrease of 61.20% with collective impairment charges recording a reversal of Rs. 1.932 Bn. Collective impairment charges, which considers the Probability of Default (PD) and the Loss Given Default (LGD) of each product portfolio, also reflect improved market conditions, improved risk acceptance and monitoring processes. Individual impairment charge is computed based on predetermined threshold levels and loans above the threshold limits are subject to individual impairment. The Bank revisited these threshold levels, which resulted in increasing the YoY Individual impairment charges by Rs. 2.053 Bn., or 148.10%. (Graph 9)
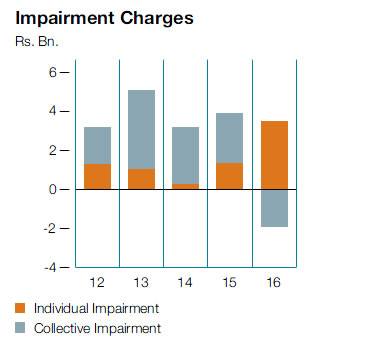
Graph 9
Operating Expenses
All components of operating expenses increased during the year due to efforts taken in supporting growth of the Bank, resulting in an overall increase of 8.73% over the previous year. The Bank’s Cost to Income ratio, which stood at 51.06% as at end 2016, is one of the lowest in the industry, reflects the focus on delivering operational excellence and the initiatives implemented. Personnel costs increased by 6.03% as head count, remuneration and staff development activities increased during the year, driving employee productivity as evinced by the improvement in all staff related ratios. Other expenses reflect a similar trend linked to growth and supported by productivity.
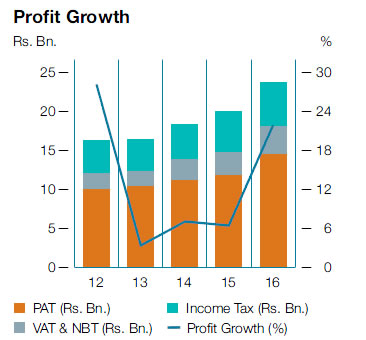
Profitability
PAT growth of 21.92% in 2016 to Rs. 14.513 Bn. was supported by higher net interest income, Net Fees and Commission Income, lower impairment provisions owing to declining NPLs, amidst unstable currency rates posed by external market volatilities. Personal Banking remains the key contributor to profitability, accounting for 56.87% of profit after tax, with Corporate Banking and International Operations contributing 27.22% and 15.66% respectively (Graph 10).
Graph 10
ROA and ROE
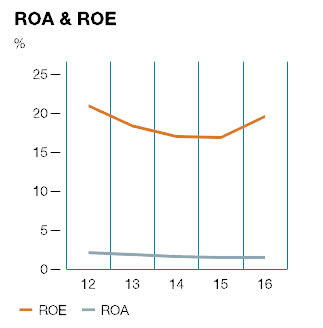
The increase in the net profit to Rs. 14.513 Bn. helped the Bank to record an improved Return on Assets (ROA) of 1.53% and Return on Equity (ROE) of 19.52%, significantly higher than 1.42% and 16.90% reported in 2015 (Graph 11 and Table 5).
Graph 11
Decomposition of ROE
| 2016 | 2015 | 2014 | 2013 | 2012 | |
| ROA (%) | 1.53 | 1.42 | 1.60 | 1.87 | 2.12 |
| PAT margin (%) | 32.91 | 28.83 | 28.62 | 28.83 | 30.59 |
| Asset utilisation (%) | 4.66 | 4.93 | 5.58 | 6.48 | 6.93 |
| Equity multiplier (Times) | 12.72 | 11.89 | 10.66 | 9.85 | 9.89 |
| ROE (%) | 19.52 | 16.90 | 17.01 | 18.40 | 20.96 |
Table 5
ROE = Equity Multiplier x ROA (PAT Margin x Asset Utilisation)
Balance Sheet Analysis
Assets
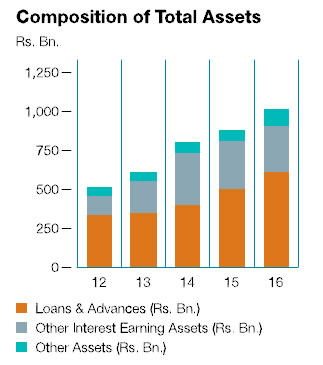
2016 was a year of accomplishment as the Bank’s asset base crossed Rupees One Trillion mark and ended at Rs. 1,012.201 Bn., signifying a twofold increase over past 5 years supported by sustained growth of fund based operations of the Bank. We are the first private bank to reach this milestone in the country (Graph 12).Our market share in term of asset size improved to 12% in 2016 from 10% in 2012. Despite sluggish industry credit growth due to a number of macro-economic factors, inter alia increasing interest rates, tightening liquidity and subdued global growth outlook, our loan growth gathered momentum into 2016 with a substantial growth higher than both historical average and industry growth.
Key contributors to loan growth were
SME, construction, tourism and other industrial sectors reflecting the growth sectors in the economy.
Graph 12
The Reverse Repurchase and Available-for-Sale Investment portfolio, declined by 24.60% in 2016, due to strategic rebalancing to fund loan growth. This was also impacted by the decline in market values of Government Securities and Bonds as interest rates increased and liquidity tightened, consequent to both Government and foreign investors exiting the Government Securities market. This portfolio now accounts for 15.81% of assets, compared to 24.12% exposure a year ago.
| Assets |
2016
(Rs. Bn.) |
2015
(Rs. Bn.) |
Growth
(YOY) |
CAGR
2011-16 |
| Total assets | 1,012.201 | 879.805 | 15.05% | 18.06% |
| Net loans & advances | 616.018 | 508.115 | 21.24% | 16.56% |
| Reverse REPO | – | 8.002 | N/A | |
| AFS Portfolio | 160.023 | 204.244 | -21.65% | 21.11% |
| Held-to-Maturity | 60.981 | – | N/A |
Table 6
Loan Growth and Asset Quality
Gross loans grew by Rs. 107.224 Bn. or 20.38% over 2015 to stand at Rs. 633.391 Bn. as at end 2016. This was the second successive year that the Bank increased its loan book by over Rs. 100 Bn. in a year. Our net loans and advances increased at a higher 21.24% to Rs. 616.018 Bn. due to a reduction in impairment provision consequent to improvement in the quality of loan portfolio and also due to rigorous recovery efforts carried out by the Bank.
Targetted marketing to lucrative segments within the economy, helped us grow our loan portfolio outperforming the industry growth rates. Loan disbursements to SME sector grew approximately by 30% in 2016, while the corporate loan book grew by 18.73% supported by lending to agriculture,tourism and construction sectors. Relaunching of the branded industrial loan ‘Diribala’ too supported loan growth. However, vehicle leasing loans declined due to higher cross border tariffs and stricker limits brought in by the CBSL on LTV Ratio, while pawning advances declined by 33.73%, owing to the responsible lending practices adopted.
Loan quality improved, supported by increased rigour in loan approvals and disbursements. Consequently, gross NPL ratio declined to 2.18% in 2016 by 56 bps from 2.74% in 2015, while net NPL ratio declined to 1.09% in 2016 by 32 bps from 1.41% in 2015, the reduction enabling the Bank to improve its provision cover to 50.11% from 48.49% a year ago.
Liabilities
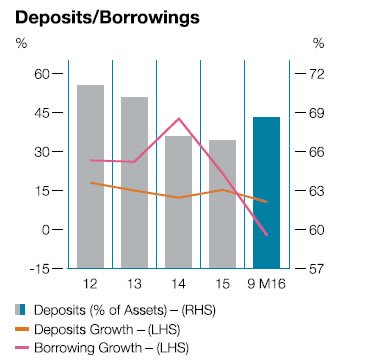
Interest-bearing liabilities grew by 16.27%, with the growth in deposits and borrowings, despite a decline in repo liabilities. Our deposits portfolio recorded a growth of 18.50% or Rs. 115.462 Bn. to Rs. 739.563 Bn. as at end of 2016. We were able to improve our deposits significantly, despite the aggressive rates offered by our competitors, owing to our widespread network of branches and confidence placed by our customers in us. Within the deposit mix, a higher growth was seen in the term deposits compared to current and saving deposits products which brought the CASA ratio to 41.67% in 2016 compared to 49.70% a year ago. (Table 7)
| Liabilities |
2016
Rs. Bn. |
2015
Rs. Bn. |
Growth
(YOY) % |
CAGR
(2011-16) % |
| Total liabilities | 933.848 | 809.464 | 15.37 | 18.62 |
| Deposits | 739.563 | 624.102 | 18.50 | 17.96 |
| Repo | 69.867 | 112.385 | -37.83 | 11.12 |
| Borrowings | 34.120 | 21.959 | 55.38 | 29.21 |
Table 7
Capital, Funding and Liquidity
Managing capital, funding and liquidity is key to optimising returns to shareholders while ensuring sufficient liquidity to meet foreseeable demands. Market liquidity, remained tight throughout most parts of the year, as credit growth picked up, resulting in increased cost of funds. Liability growth of 15.37% was driven by strong growth in deposits, which accounted for 92.83%. To supplement deposit growth, the Bank raised Rs. 13.179 Bn. in two debenture offerings in March and October, strengthening Tier II capital. Both these debenture issues were oversubscribed within hours of opening such issues, depicting strong confidence placed in us by our valued investors.
Equity improved by 11.39% in 2016 supported by growth in profits, enhancing the Bank’s single borrower limits to Rs. 24.674 Bn. for individual customers and Rs. 27.240 Bn. for group customers, making it one of the highest in the country.
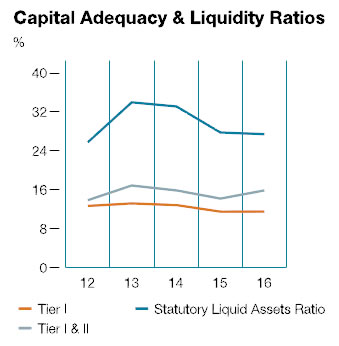
Capital adequacy ratios of 11.56% for Tier I and 15.89% for Tier I & II, remain well above the regulatory requirements of 5% for Tier I and 10% for Tier I & II Capital. The year end Statutory Liquid Assets Ratio of 27.41% was well above the regulatory minimum of 20% (Graph 13).
Graph 13
Group Performance
The Commercial Bank Group consists of five subsidiaries, namely, Commercial Development Company PLC (CDC), ONEzero Company Ltd., Serendib Finance Company Ltd., Commex Sri Lanka S.R.L. located in Italy and Commercial Bank of Maldives Private Limited and two Associates, namely, Equity Investments Lanka Ltd. and Commercial Insurance Brokers (Pvt) Ltd. However, given the scale of operations of the Bank, the results of these entities are not material to the Bank and hence a brief review of their operations is presented in the sections on ‘Subsidiaries and Associates’ and ‘Group Structure’ on page 102 and page 442.
Creating Value to Shareholders
The Bank creates value to shareholders through the payment of dividend and increased value of shares. The Bank’s dividend policy seeks to maximise shareholder wealth, maintain a consistent stream of dividend to shareholders and increase market capitalisation, whilst ensuring that there is sufficient capital for planned business expansion. The Bank paid two interim dividends of Rs. 1.50 per share and Rs. 3.00 per share in December 2016 and February 2017. The Board of Directors of the Bank has now proposed a final dividend of Rs. 2.00 per share which will be satisfied in the form of scrip dividend. Dividend per share has been maintained at a consistent Rs. 6.50 per share since 2012, to ensure a balance between retaining capital for business expansion and recognition of shareholder expectations (Graph 14).
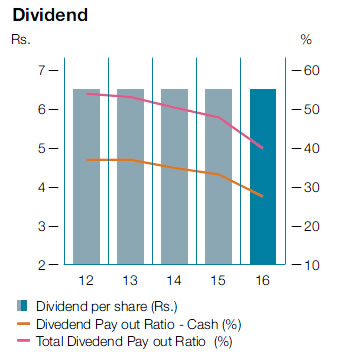
Graph 14
Snapshot: Financial Results 2016
|
Absolute
Growth
Rs. Mn. |
Growth
2016 (YoY)
% |
CAGR
(2011-16)
% |
Explanation | |
| Financial Performance | ||||
|
Net interest income |
2,478 | 8.17 | 11.90 | Growth supported by growth in the loan portfolio. |
|
Net fee & commission income |
1,641 | 30.54 | 16.10 | Growth supported by increased contribution from trade finance activities and usage of credit and debit cards. |
|
Losses from Trading |
-2,280 | -280.32 | -26.01 | Mark to market losses especially on FX SWAPs. |
| Other income | 1,562 | 38.53 | 6.18 | Higher loan recoveries and investment income from equity portfolio. |
|
Total Operating Income |
2,819 | 6.83 | 11.34 | Despite trading losses, higher interest income, fees and commission income and other income sustained growth though slow paced. |
| Impairment charges | -2,413 | -61.20 | -3.29 | Reversal on collective impairment driven by an improvement in the loan portfolio and improving credit scoring. |
|
Profit before VAT, NBT & Income Tax |
3,722 | 18.58 | 13.85 | Benefited from higher net interest income, fees and commission income and lower impairment albeit the mark to market loss on FX SWAPs. |
|
VAT,NBT & Income Tax |
1,112 | 13.68 | 15.29 | Impacted by the rise in VAT for the banking sector. However, effective income tax rate declined due to tax planning measures. |
|
Profit after Tax |
2,609 | 21.92 | 12.98 | Recorded a noteworthy growth due to the combination of all above mentioned reasons. |
| Financial Position | ||||
| Assets | 132,396 | 15.05 | 18.06 | Loans continued to be the core contributor to asset growth. |
|
Net loans & receivables |
107,903 | 21.24 | 16.56 | Despite the subdued credit demand in 2016, Bank managed to grow its loans by adopting a strategy of maintaining interest rates despite the rate hike. |
| Liabilities | 124,383 | 15.37 | 18.62 | Deposits and borrowings supported the liability growth. |
| Deposits | 115,462 | 18.50 | 17.96 | Increasing interest rates encouraged deposits in line with the industry trend. A shift to time from savings deposits was noticed. |
| Borrowings | 12,161 | 55.38 | 29.21 | Growth supported by the two debenture issues in 2016. |
Table 8
Manufactured Capital
This refers to capital goods stock build by the Bank over past to deliver customer expectations. Having identified the importance of this important capital, which is easily identifiable due to its nature, the Bank focuses in developing infrastructure in order to support current business activities and also to meet future challenges given the importance of this capital in the value creation process.
The Bank has already been able to reap benefits of moneys spent on strengthening infrastructure of the Bank. The Bank will continuously invest in ICT with the objective of delivering unmatchable customer experience through technology.
Further, the Bank is mindful of the requirement to maintain the state of art work environment within the Bank premises and continuously invest sufficiently in upbringing the existing premises to be line with industry standards.
Consequent to the above initiatives the total amount invested in the Manufactured Capital of the Bank which are represented in the form of Property, Plant and Equipment, Intangible Assets and Leasehold properties stood at Rs. 11.022 Bn. as at end of 2016.