Gain insights in to the dynamics of the operating environment and its impact on our operations. Read our capital management reports to understand how we transformed the capitals to deliver value in a responsible manner. Understand the impact of each business vertical on our overall performance and how each was managed within the constraints and opportunities presented by the operating environment.
Our Operating Environment
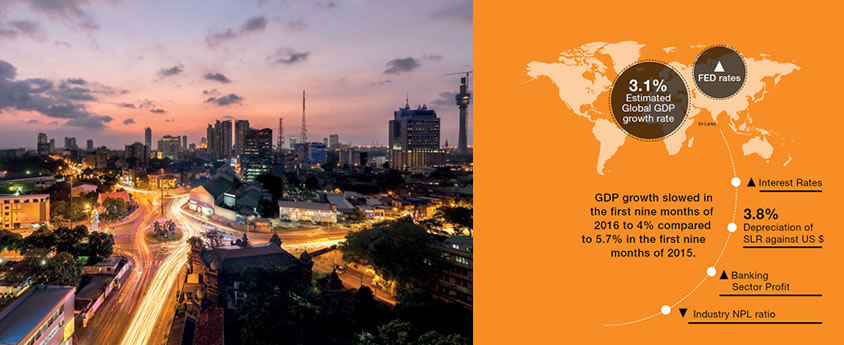
The Bank has performed exceptionally well in all key areas of business activities during 2016 and maintained its growth trajectory in an extremely challenging environment
Overview of Global Economic and Business Environment
The global output is estimated to have grown by a lower pace of 3.1% in 2016 reflecting weaker than expected US activity, reduction in trade and financial flows between the UK and the rest of the EU with the Brexit, and lower commodity prices etc. Stagnant global trade, subdued investment, and heightened policy uncertainty marked another difficult year for the world economy. Meanwhile global events such as Brexit, US elections in late 2016 and changing policies especially in China and US increased uncertainty in trade policies. Activities in Russia was slightly better than expected, in part reflecting firmer oil prices.
Regional Performance of Major Economies in the World
United States
| Percentage of | |||
| Global GDP* | Global Trade* | Global FDI Stock* | Share of SL Trade* |
| 24%1 | 23% | 17 % | 27% of exports |
*2015
Source: IMF & CBSL
US continued its dominating role in global markets resulting in its slow-paced growth, trade activity and trade policies to have spillover effects on global growth and trade (Table 1). US GDP growth declined to 1.6% in 2016 compared to 2.6% in 2015 reflecting weakened demand conditions and lowering investments especially in the 1st quarter of 2016. However, signs of recovery were seen in the latter half of 2016 with a rebound of manufacturing activities and fiscal stimulus policies proposed to support future demand and investment growth.
Meanwhile Federal (FED) increased its target for short-term interest rates by 0.25% points to a range of 0.50% and 0.75% on December 14, 2016. Bond yields have been increasing reflective of both rate hike and uncertain policies, exerting pressure on global financial markets with higher borrowing costs. Risks relating to cross border agreements especially with China and Mexico persist and pose a significant threat to global investor confidence and trade under Trump government.
Euro Area
Challenging global environments, weakening demand and spillover effects of the Euro debt crisis, slowed growth to 1.7% in 2016. Banks continued to suffer with weak profitability levels (Table 2). Despite the bleak outlook, overall investor confidence showed some recovery in 2016 while Brexit in June 2016 and continued low investments in highly debt affected countries such as Greece, posed a risk. Easing of borrowing costs supported by the adoption of negative interest rate policy in June 2014 further supported investor confidence.
China – 15% of Global GDP2, 20% of Sri Lanka Imports3
GDP growth slowed to 6.7% in 2016 (6.9% in 2015), as the economy shifts from industry to services in line with government policies. Consumption growth remained strong while investment growth slowed and focused on policy induced infrastructure spending. Thus, import demand especially capital goods contracted impacting global trade activity significantly.
World Economic Outlook Projections
|
2015
% |
2016
(Estimated) % |
2017 (Projected) % |
||||
| World Output | 3.2 | 3.1 | 3.4 | |||
| Advanced Economies | 2.1 | 1.6 | 1.9 | |||
| United States | 2.6 | 1.6 | 2.3 | |||
| Euro Area | 2.0 | 1.7 | 1.6 | |||
| Japan | 1.2 | 0.9 | 0.8 | |||
| United Kingdom | 2.2 | 2.0 | 1.5 | |||
| Emerging Markets and Developing Economies | 4.1 | 4.1 | 4.5 | |||
| Russia | -3.7 | -0.6 | 1.1 | |||
| China | 6.9 | 6.7 | 6.5 | |||
| India | 7.6 | 6.6 | 7.2 | |||
| ASEAN 6 | 4.8 | 4.8 | 4.9 |
Source: IMF January 2017
Table 2
1World Bank data
2Trading economics (www.tradingeconomics.com/china/gdp)
3Central Bank report 2015
Sri Lanka
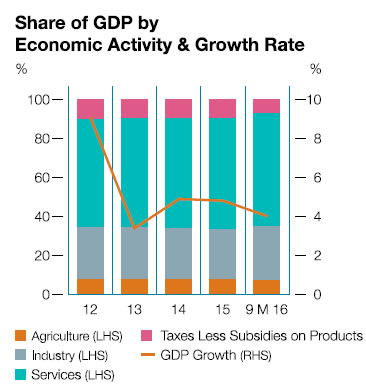
GDP growth slowed in the first nine months of 2016 to 4.0% compared to 5.7% in the first nine months of 2015, impacted by negative growth in agriculture and declining growth in transportation and real estate segments (Graph 1). Adverse global environments, higher taxes on motor vehicles imports, increase in interest rates and supply disruptions in agricultural output negatively impacted the sectoral growth rates. The credit growth slowed in the latter part of 2016 in response to monetary tightening measures adopted by the Central Bank of Sri Lanka (the CBSL).
Source: Statistics Department
Graph 1
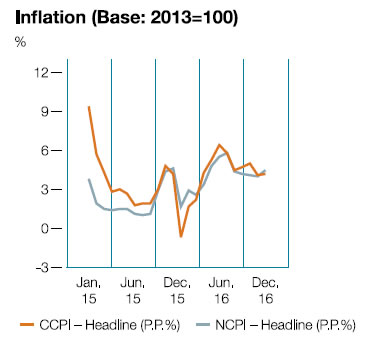
Inflation, measured by the NCPI (Base year 2013) reflected an upward trend of 4.2% in December 2016 (Graph 2). The increase in inflation in latter part of the year was mainly attributed to the impact of tax adjustments and the supply disruptions due to adverse weather conditions. However, the inflation has been within the CBSL mid-single digit targets of 4%-6%.4
Source: Statistics Department
Graph 2
External trade activities recorded a modest performance in the first eleven months of 2016 with deterioration in the trade deficit as a result of increased import expenditure, amidst the contraction in export earnings due to adverse global conditions especially in core trading partners such as US, EU and China. However, the earnings from tourism and workers’ remittances continued to dampen the adverse impact of the trade deficit on the overall balance
of payment.
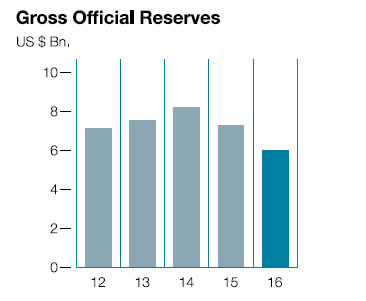
The Sri Lankan Rupee continued to depreciate against the US $ in 2016 given the widening trade deficit, increase in outflows of foreign investments from the Rupee denominated Government Securities market and lower FDI etc. Meanwhile, the Government entered into a three-year programme of US $ 1.5 Bn. with the International Monetary Fund (IMF), under the Extended Fund Facility (EFF) in June 2016 to support the Balance of Payments (BOP) position and the Government’s economic reform agenda. The gross official reserves were US $ 6.0 Bn. by end 2016.
Source: CBSL
Graph 3
Sri Lankan Economic Overview with Relevance to Banking Sector
Sri Lanka’s financial sector, accounting for 6.4% of GDP, recorded a strong growth of 14.3% in the first nine months of 2016, above the five-year historical average of 12%, and among the top growth sectors in the country in 2016.
Interest rates continuously increased in 2016 in line with the adjustments in the monetary policy of the CBSL (Graph 4). Loan demand weakened with hike in interest rates, uncertainty in policies, adverse global conditions and tighter control on imports especially vehicles and consumer goods.
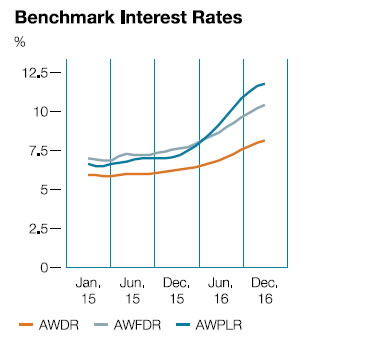
Source: CBSL
Graph 4
Private sector credit growth eased to 21.9% by December, 2016 compared to higher credit growth rates in the first nine months of 2016 (Graph 5). However, the credit disbursements in absolute terms remained high in 2016. Increase in VAT rate adversely impacted the banking sector profits.
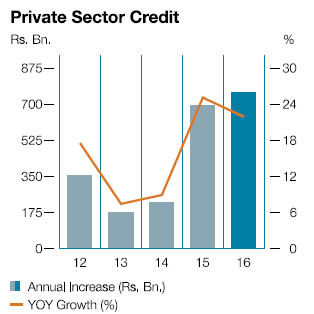
Source: CBSL
Graph 5
Banking sector continued its growth trajectory to 2016 with a profit growth of 19% YoY in the first nine months of 2016, higher than five-year average of 11%, despite continued pressures from global markets and increasing local tax rates. Sector ROE remained attractive at 17% in the third quarter 2016.
- Interest income grew by 21% YoY in the first nine months of 2016 due to the increase in interest rates following the increase in policy rates by the CBSL.
- Asset quality improved with declining non-performing loans. Net NPL ratios of 1.6% in the first nine moths of 2016 were significantly lower than historical average of 2.6% (Graph 6).
Asset growth moderated in the first nine months of 2016 with declining loan demand reflective of higher interest rates, lower imports and declining private consumption. Despite the slowdown, loans continued to account for 59% of assets.
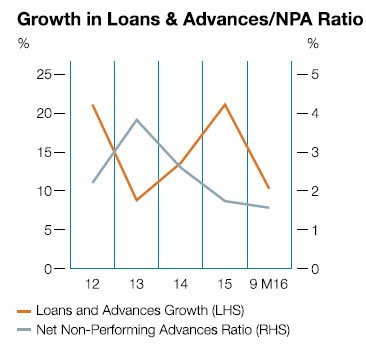
Source: CBSL
Graph 6|
Deposits, predominantly time and savings deposits, continued to fund asset growth, with 18% YoY growth in the first nine months of 2016 (Graph 7). Capital adequacy ratios (CAR) remained above regulatory minimum rates despite the core CAR declined to 11.6% in the first nine months of 2016.
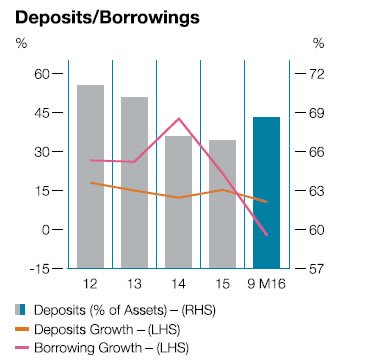
Source: CBSL
Graph 7
Key Banking Industry Indicators
| Industry | First nine months of 2016 |
CAGR* 2010-15 |
||
| Business Volumes | ||||
| Assets (YoY) | 13% | 18% | ||
| Loans (YoY) | 16% | 19% | ||
| Asset funding | ||||
| Deposits (YoY) | 17% | 16% | ||
| Borrowings (YoY) | 3% | 28% | ||
| Profitability | ||||
| Interest income (YoY) | 21% | 12% | ||
| Return on equity | 17% | 18% | ||
| Net interest margin | 3.5% | 3.9% | ||
| Net NPL ratio | 1.6% | 2.6% | ||
| Capital adequacy | ||||
| Core capital ratio (Minimum 5%) | 11.6% | 14.2% | ||
| Liquidity | ||||
| Liquid asset ratio (Minimum 20%) | 28.3% | 35.2% |
*Compound Annual Growth Rate
Source: CBSL
Table 4
Movement of Key Economic Indicators and their Impact on the Banking Industry
| Parameter | Movement during 2016 | Cause of movement | Impact to sector | |||
| GDP | GDP growth declined to 4.0% in the first nine months of 2016 compared to 5.7% in the first nine months of 2015. Private consumption and investment growth slowed in 2016. | Lower agricultural output and decline in transportation and real estate activities weighed on growth despite the recovery of construction activity and continued growth in financial services and wholesale trade. | Declining demand conditions impacted on low growth in banking sector credit. | |||
| External trade | External trade activity contracted due to decline in global trade activities and adjustments in interest rates and Government taxes. | Growth in textile exports and imports of investment goods, building materials and machinery despite a decline in consumer goods including vehicles and intermediate goods imports. Vehicle imports declined by 42.8% during the first ten months of 2016. | Significant drop in vehicle registrations impacted leasing demand. | |||
| Investments | Foreign direct investments slowed. | Weakening global environment and lack of investor friendly policies. | Lower demand for industrial loans. | |||
| Exchange rate | Depreciation of the Sri Lankan Rupee against US $ by 3.8% in 2016. | Trade deficit widened in the first eleven months of 2016. FDIs were below expectations. Outflows of foreign investments from the Rupee denominated Government Securities market. | Lower demand for trade related facilities. | |||
| Regulations | Stricter control on vehicle leasing business to curb imports. Increased taxes such as VAT on banking operations. | Government reduced the loan to value (LTV) ratio for vehicle leasing to 70%. | Profits impacted by higher taxes and lower demand for leasing. | |||
| Interest rates | Increasing trend in interest rates during 2016. | Curb inflationary pressures due to rising private consumption and imports since 2015. | Had a positive impact on interest income and deposit growth. However, adversely impacted the credit growth. |
It is the power of the Mind human mind that will define the “shape and
colour” of the future
of banking and set the
stage to expedite its
arrival. Cutting edge
inventions to evolving
customer needs – all
things stem from the
power of the human
mind. We can be
certain that the mind,
operating in a stimulating
environment will continue
to drive invention and
revolutionise the future
of banking.
As structure is to
business, the mind is
to innovation