Investor relations
Constructive dialogue with investors is key to good governance, providing inputs to strategy formulation for long-term value creation. We are proud of our track record of active engagement with our shareholders and seek to provide relevant and sufficient information within this report to facilitate informed and constructive dialogue at the forthcoming Annual General Meeting.
This segment of the report provides information on the performance of the Bank’s listed securities.
1. Our Listed Securities
The ordinary shares of the Bank are listed on the Main Board of the Colombo Stock Exchange (CSE) under the ticker symbol ‘COMB’. All debentures issued are also listed on the CSE.
Summary of trading activity and daily prices of shares and debentures are published in most daily newspapers, including the Daily News, Daily FT, The Island and Daily Mirror under the abbreviation of Commercial Bank or COMB (Table 13).
| Security Type | Number in Issue as at | Ticker Symbol | |
| 31.12.2016 | 31.12.2015 | ||
| Equity | |||
| Ordinary Shares – Voting | 833,521,887 | 820,567,115 | COMB.N0000 |
| Ordinary Shares – Non-Voting | 57,212,653 | 56,299,686 | COMB.X0000 |
| Debt | |||
|
Fixed Rate Debentures March 2016/21 |
44,303,400 | – | COMB-BD- 08/03/21- C2341-10.75% |
|
Fixed Rate Debentures March 2016/26 |
17,490,900 | – | COMB-BD- 08/03/26- C2342-11.25% |
|
Fixed Rate Debentures October 2016/21 |
50,718,000 | – | COMB-BD- 27/10/21- C2360-12.00% |
|
Fixed Rate Debentures October 2016/26 |
19,282,000 | – | COMB-BD- 27/10/26- C2359-12.25% |
| Newswire Codes | |||
| Bloomberg | |||
| Dow Jones | |||
| Reuters | |||
Table 13
Share Price Trend Over Last Five Years
| 2016 | 2015 | 2014 | 2013 | 2012 | |
| Ordinary Shares Voting | |||||
| Highest price (Rs.) | 151.90 | 194.00 | 179.90 | 126.00 | 119.50 |
| Lowest price (Rs.) | 115.00 | 139.90 | 113.50 | 103.20 | 96.80 |
| Last traded price (Rs.) | 145.00 | 140.20 | 171.00 | 120.40 | 103.00 |
| Ordinary Shares Non-Voting | |||||
| Highest price (Rs.) | 123.00 | 149.00 | 125.50 | 102.00 | 99.50 |
| Lowest price (Rs.) | 101.50 | 122.10 | 91.30 | 87.00 | 73.00 |
| Last traded price (Rs.) | 115.00 | 123.00 | 125.10 | 93.00 | 91.10 |
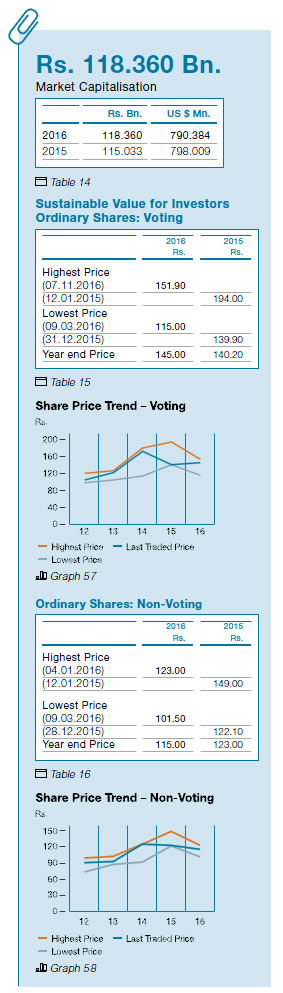
2. Performance of Securities and Return to Shareholders
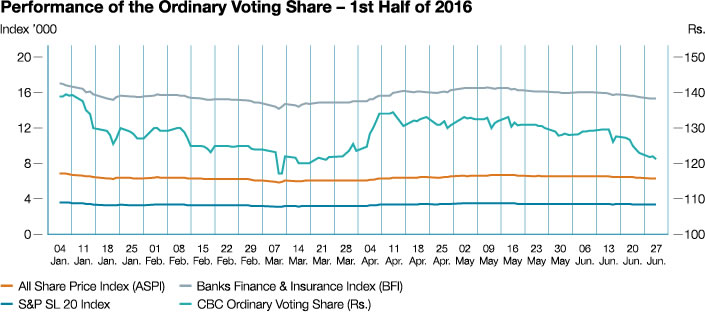
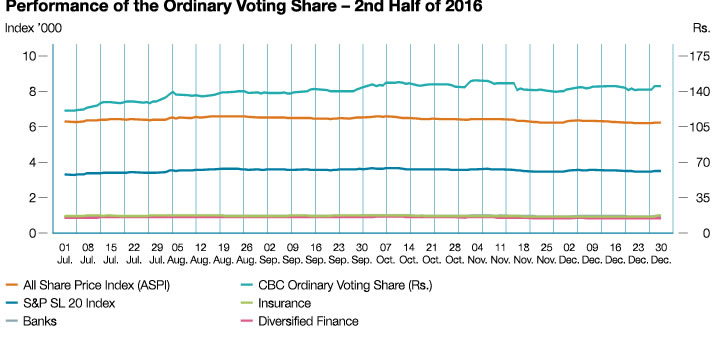
Market performance moderated during the year reflecting the weak investor appetite, moderating economic growth, rising interest rates and inflation during the year. The All Share Price Index and the S&P SL 20 Index remained in the doldrums as domestic and foreign activity declined sharply by 38.28% and 14.59% respectively. Foreign and local companies were net purchasers albeit at reduced volumes while foreign and local individuals were net sellers. The Banking, Finance and Insurance sectors also reflected a downward trend during the year.
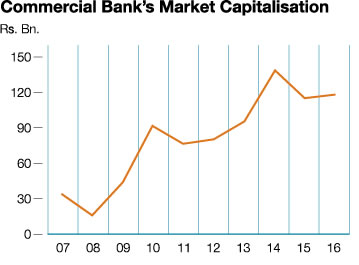
Despite the bleak market performance, the ordinary voting shares of the Bank performed creditably, increasing by 3.42% from Rs. 140.20 at the end of 2015 to Rs.145.00 as at the end of 2016 (Table 15). The number of shares in both categories increased during the year as the Bank continued with its policy of issuing scrip dividends and operationalised the ESOP (Section 3.1). Accordingly, market capitalisation increased from Rs.115 Bn. in 2015 to Rs.118 Bn. in 2016 accounting for 4.31% of the total market capitalisation. Movement of the non-voting share price followed the trend of the voting shares during most part of 2016.
Graph 59
Graph 60
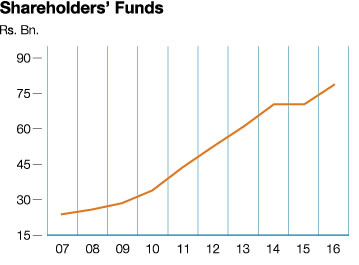
Information on Shareholders’ funds and Market Capitalisation
| As at December 31, | Shareholders’ Funds | Commercial Bank’s Market Capitalisation(*) | Total Market Capitalisation of the CSE | Commercial Bank’s Market Capitalisation as a % of CSE Market Capitalisation | Commercial Bank’s Market Capitalisation Ranking |
| Rs. Bn. | Rs. Bn. | Rs. Bn. | % | Rank | |
| 2016 | 78 | 118 | 2,745 | 4.31 | 3 |
| 2015 | 70 | 115 | 2,938 | 3.92 | 3 |
| 2014 | 71 | 139 | 3,105 | 4.46 | 3 |
| 2013 | 61 | 96 | 2,286 | 4.18 | 4 |
| 2012 | 53 | 80 | 2,168 | 3.71 | 5 |
| 2011 | 44 | 77 | 2,269 | 3.37 | 6 |
| 2010 | 34 | 92 | 2,281 | 4.03 | 4 |
| 2009 | 28 | 44 | 1,092 | 4.06 | 5 |
| 2008 | 26 | 16 | 489 | 3.20 | 4 |
| 2007 | 24 | 34 | 821 | 4.17 | 4 |
*Commercial Bank’s market capitalisation includes only Ordinary Voting Shares
Table 17
Graph 61
Graph 62
Market indices for Banks, Finance and Insurance were available only from the second half of 2016.
Graph 63
Graph 64
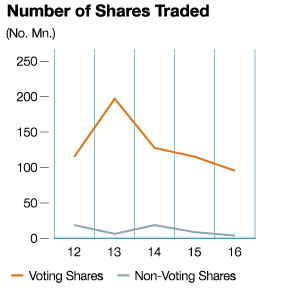
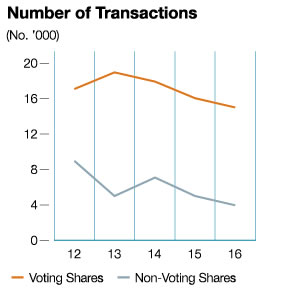
The number of shares traded in both voting and non-voting shares declined during the year (Graph 63) as many investors adopted a holding strategy on the stock in view of its performance. Interestingly, the number of transactions in ordinary voting shares (Graph 64) was similar to 2015 pointing to sustained interest in the shares (Table 18).
| Ordinary Voting Shares | Ordinary Non-Voting Shares | |||
| 2016 | 2015 | 2016 | 2015 | |
| Number of transactions | 15,189 | 15,575 | 3,721 | 5,073 |
| Number of shares traded | 96,145,515 | 117,372,662 | 5,395,928 | 9,552,654 |
| Value of shares traded (Rs. Bn.) | 12.86 | 19.39 | 0.62 | 1.28 |
Table 18
The total return to shareholders during the year amounted to Rs. 11.30 per share comprising cash and scrip dividends of Rs. 6.50 and capital gains of Rs. 4.80. This amounts to a return to shareholders of 11.25% for the year. Total return over the last
five years is approximately 10.14% on the same basis.
3. Stated Capital
The Bank continued with its policy of issuing scrip dividends and the movement in our issued capital over the past three decades is given below in accordance with Rule 7.6 (ix) of the Listing Rules of the CSE. Accordingly, 11,818,040 voting shares and 912,967 non-voting shares were issued during the year as approved by shareholders at the Annual General Meeting (AGM) held in March 2016. The ESOP approved by shareholders in 2016 was operationalised during the year which together with ESOP introduced in 2008 contributed to increase the number of shares in issue by 1,136,732.
3.1 Information on Movement in Number of Shares Represented by the Stated Capital
(As per Rule No. 7.6 (ix) of the Listing Rules of the CSE)
| No. of Shares | |||||||
| Year | Details | Basis | No. of Shares Issued/ (Redeemed) | Ordinary Shares Voting | Ordinary Shares Non-voting | Cumulative Redeemable Preference Shares | |
| 1987 | As at December 31, 1987 | 3,000,000 | – | – | |||
| 1988 | Bonus Issue | Voting | 2 for 3 | 2,000,000 | 5,000,000 | – | – |
| 1990 | Bonus Issue | Voting | 1 for 1 | 5,000,000 | 10,000,000 | – | – |
| 1993 | Rights Issue | Voting | 1 for 4 | 2,500,000 | 12,500,000 | – | – |
| 1996 | Bonus Issue | Voting | 3 for 5 | 7,500,000 | 20,000,000 | – | – |
| Rights Issue | Voting | 1 for 4 | 5,000,000 | 25,000,000 | – | – | |
| Share Swap | Non-voting | 894,275 | 25,000,000 | 894,275 | – | ||
| Bonus Issue | Non-voting | 3 for 5 | 536,565 | 25,000,000 | 1,430,840 | – | |
| Rights Issue | Non-voting | 1 for 4 | 357,710 | 25,000,000 | 1,788,550 | – | |
| 1998 | Bonus Issue | Voting | 3 for 10 | 7,500,000 | 32,500,000 | 1,788,550 | – |
| Bonus Issue | Non-voting | 3 for 10 | 536,565 | 32,500,000 | 2,325,115 | – | |
| 2001 | Bonus Issue | Voting | 1 for 5 | 6,500,000 | 39,000,000 | 2,325,115 | – |
| Bonus Issue | Non-voting | 1 for 5 | 465,023 | 39,000,000 | 2,790,138 | – | |
| Issue of Cumulative Redeemable Preference Shares | 90,655,500 | 39,000,000 | 2,790,138 | 90,655,500 | |||
| 2003 | Bonus Issue | Voting | 1 for 3 | 13,000,000 | 52,000,000 | 2,790,138 | 90,655,500 |
| Rights Issue | Voting | 1 for 4 | 13,000,000 | 65,000,000 | 2,790,138 | 90,655,500 | |
| Bonus Issue | Non-voting | 1 for 3 | 930,046 | 65,000,000 | 3,720,184 | 90,655,500 | |
| Rights Issue | Non-voting | 1 for 4 | 930,046 | 65,000,000 | 4,650,230 | 90,655,500 | |
| Issue of Cumulative Redeemable Preference Shares | 100,000,000 | 65,000,000 | 4,650,230 | 190,655,500 | |||
| 2004 | ESOP | Voting | 29,769 | 65,029,769 | 4,650,230 | 190,655,500 | |
| 2005 | ESOP | Voting | 1,361,591 | 66,391,360 | 4,650,230 | 190,655,500 | |
| Bonus Issue | Voting | 1 for 1 | 66,389,162 | 132,780,522 | 4,650,230 | 190,655,500 | |
| Bonus Issue | Non-voting | 1 for 1 | 4,650,230 | 132,780,522 | 9,300,460 | 190,655,500 | |
| 2006 | ESOP | Voting | 737,742 | 133,518,264 | 9,300,460 | 190,655,500 | |
| Redemption of Cumulative Redeemable Preference Shares | (90,655,500) | 133,518,264 | 9,300,460 | 100,000,000 | |||
| 2007 | Rights Issue | Voting | 3 for 10 | 40,288,996 | 173,807,260 | 9,300,460 | 100,000,000 |
| Bonus Issue | Voting | 1 for 3 | 58,204,268 | 232,011,528 | 9,300,460 | 100,000,000 | |
| ESOP | Voting | 919,649 | 232,931,177 | 9,300,460 | 100,000,000 | ||
| Rights Issue | Non-voting | 3 for 10 | 2,790,138 | 232,931,177 | 12,090,598 | 100,000,000 | |
| Bonus Issue | Non-voting | 1 for 3 | 4,030,199 | 232,931,177 | 16,120,797 | 100,000,000 | |
| 2008 | Redemption of Cumulative Redeemable Preference Shares | (100,000,000) | 232,931,177 | 16,120,797 | – | ||
| ESOP | Voting | 350,049 | 233,281,226 | 16,120,797 | – | ||
| 2009 | ESOP | Voting | 540,045 | 233,821,271 | 16,120,797 | – | |
| 2010 | Share Split | Voting | 1 for 2 | 117,402,608 | 351,223,879 | 16,120,797 | – |
| Share Split | Non-voting | 1 for 2 | 8,060,398 | 351,223,879 | 24,181,195 | – | |
| ESOP | Voting | 2,081,508 | 353,305,387 | 24,181,195 | – | ||
| 2011 | Scrip issue for final dividend 2010 | Voting | 2,277,195 | 355,582,582 | 24,181,195 | – | |
| Scrip issue for final dividend 2010 | Non-voting | 255,734 | 355,582,582 | 24,436,929 | – | ||
| ESOP | Voting | 1,457,645 | 357,040,227 | 24,436,929 | – | ||
| Rights Issue | Voting | 1 for 14 | 25,502,433 | 382,542,660 | 24,436,929 | – | |
| Rights Issue | Non-voting | 1 for 14 | 1,745,494 | 382,542,660 | 26,182,423 | – | |
| Share Split | Voting | 1 for 1 | 382,542,660 | 765,085,320 | 26,182,423 | – | |
| Share Split | Non-voting | 1 for 1 | 26,182,423 | 765,085,320 | 52,364,846 | – | |
| 2012 | Scrip issue for final dividend 2011 | Voting | 13,587,144 | 778,672,464 | 52,364,846 | – | |
| Scrip issue for final dividend 2011 | Non-voting | 1,108,902 | 778,672,464 | 53,473,748 | – | ||
| ESOP | Voting | 1,341,768 | 780,014,232 | 53,473,748 | – | ||
| 2013 | Scrip issue for final dividend 2012 | Voting | 13,076,189 | 793,090,421 | 53,473,748 | – | |
| Scrip issue for final dividend 2012 | Non-voting | 1,069,474 | 793,090,421 | 54,543,222 | – | ||
| ESOP | Voting | 1,445,398 | 794,535,819 | 54,543,222 | – | ||
| 2014 | Scrip issue for final dividend 2013 | Voting | 12,504,344 | 807,040,163 | 54,543,222 | – | |
| Scrip issue for final dividend 2013 | Non-voting | 1,036,724 | 807,040,163 | 55,579,946 | – | ||
| ESOP | Voting | 3,237,566 | 810,277,729 | 55,579,946 | – | ||
| 2015 | Scrip issue for final dividend 2014 | Voting | 8,118,773 | 818,396,502 | 55,579,946 | – | |
| Scrip issue for final dividend 2014 | Non-voting | 719,740 | 818,396,502 | 56,299,686 | – | ||
| ESOP | Voting | 2,170,613 | 820,567,115 | 56,299,686 | – | ||
| 2016 | Scrip issue for final dividend 2015 | Voting | 11,818,040 | 832,385,155 | 56,299,686 | – | |
| Scrip issue for final dividend 2015 | Non-voting | 912,967 | 832,385,155 | 57,212,653 | – | ||
| ESOP | Voting | 1,136,732 | 833,521,887 | 57,212,653 | – | ||
3.2 Information on Share Splits and Scrip Issues
| Year/Month | Details |
| 2016 April | Issue of ordinary shares to satisfy a part of the final dividend for 2015 of Rs. 2.00 per ordinary share |
| 2015 April | Issue of ordinary shares to satisfy a part of the final dividend for 2014 of Rs. 2.00 per ordinary share |
| 2014 April | Issue of ordinary shares to satisfy a part of the final dividend for 2013 of Rs. 2.00 per ordinary share |
| 2013 April | Issue of ordinary shares to satisfy a part of the final dividend for 2012 of Rs. 2.00 per ordinary share |
| 2012 April | Issue of ordinary shares to satisfy a part of the final dividend for 2011 of Rs. 2.00 per ordinary share |
| 2011 September | Share split of one ordinary share for every one ordinary share held immediately after the right issue |
| 2011 August | Rights issue of one ordinary share for every fourteen ordinary shares held |
| 2011 April | Issue of ordinary shares to satisfy a part of the final dividend for 2010 of Rs. 2.00 per ordinary share |
| 2010 June | Share split of one ordinary share for every two ordinary shares held |
| 2007 June | Bonus issue of one ordinary share for every three ordinary shares held |
| 2007 April | Rights issue of three ordinary shares for every ten ordinary shares held |
| 2005 June | Bonus issue of one ordinary share for every one ordinary share held |
| 2003 October | Rights issue of one ordinary share for every four ordinary shares held |
| 2003 May | Bonus issue of one ordinary share for every three ordinary shares held |
4. Dividends
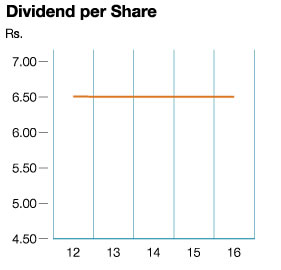
Dividends are declared balancing the needs of shareholders for a return on investment and the business needs of the Bank. The Bank paid two interim dividends totalling to Rs. 4.50 per share in cash for the year 2016. The Board of Directors of the Bank has now recommended a final dividend of Rs. 2.00 per ordinary share, to be satisfied in the form of issue and allotment of new shares for both voting and non-voting shareholders of the Bank for the year ended December 31, 2016 for approval by the shareholders at the 48th AGM, to be held on March 30, 2017. (The Bank declared a final dividend of Rs. 5.00 per share for the year ended December 31, 2015 which consists of a cash dividend of Rs. 3.00 per share and balance entitlement of Rs. 2.00 per share satisfied in the form of issue and allotment of new shares).
| Dividends | 2016 | 2015 | ||
| Cash – Rs. per share | ||||
| First interim paid | 1.50 | 1.50 | ||
| Second interim paid | 3.00 | – | ||
| Final proposed/paid | – | 3.00 | ||
| Total | 4.50 | 4.50 | ||
| Scrip – Rs. per share | ||||
| Final proposed/allotted | 2.00 | 2.00 | ||
| Total | 6.50 | 6.50 | ||
| Dividend payout ratio (%) | ||||
| Cash | 27.64 | 33.15 | ||
| Total (Cash and Shares) | 39.92 | 47.89 |
Table 19
Graph 65
5. Shareholders
Commercial Bank has a total of 9,610 Ordinary voting shareholders as at December 31, 2016, an increase of 2.10% over 2015, expanding our shareholder base (Table 20). The percentage of ordinary voting shares held by the 20 largest shareholders has increased from 66.77% in 2015 to 69.01% in 2016 with four new investors joining its ranks. Non-voting ordinary shares held by the 20 largest shareholders have increased even more sharply from 38.45% in 2015 to 42.90% in 2016 with three new investors making significant purchases during 2016 of which two were foreign investors (Section 5.3). However, the total number of foreign shareholders declined during the year primarily due to weak market performance that prevailed during 2016.
Number of Ordinary Shareholders
| 2016 | 2015 | |
| Voting shareholders | 9,610 | 9,412 |
| Non-voting shareholders | 4,191 | 4,216 |
| Total | 13,801 | 13,628 |
Table 20
5.1 Composition of Shareholders
| As at December 31, 2016 | As at December 31, 2015 | |||||||
| No. of Shareholders | % | No. of Shares | % | No. of Shareholders | % | No. of Shares | % | |
| Ordinary Shares – Voting | ||||||||
| Resident | 9,314 | 96.92 | 587,487,079 | 70.48 | 9,094 | 96.62 | 558,973,595 | 68.12 |
| Non-resident | 296 | 3.08 | 246,034,808 | 29.52 | 318 | 3.38 | 261,593,520 | 31.88 |
| Total | 9,610 | 100.00 | 833,521,887 | 100.00 | 9,412 | 100.00 | 820,567,115 | 100.00 |
| Individuals | 9,058 | 94.26 | 193,603,082 | 23.23 | 8,847 | 94.00 | 187,853,981 | 22.89 |
| Institutions | 552 | 5.74 | 639,918,805 | 76.77 | 565 | 6.00 | 632,713,134 | 77.11 |
| Total | 9,610 | 100.00 | 833,521,887 | 100.00 | 9,412 | 100.00 | 820,567,115 | 100.00 |
| Ordinary Shares – Non-Voting | ||||||||
| Resident | 4,107 | 98.00 | 43,843,846 | 76.63 | 4,128 | 97.91 | 44,666,354 | 79.34 |
| Non-resident | 84 | 2.00 | 13,368,807 | 23.37 | 88 | 2.09 | 11,633,332 | 20.66 |
| Total | 4,191 | 100.00 | 57,212,653 | 100.00 | 4,216 | 100.00 | 56,299,686 | 100.00 |
| Individuals | 3,970 | 94.73 | 32,320,757 | 56.49 | 3,997 | 94.81 | 32,174,283 | 57.15 |
| Institutions | 221 | 5.27 | 24,891,896 | 43.51 | 219 | 5.19 | 24,125,403 | 42.85 |
| Total | 4,191 | 100.00 | 57,212,653 | 100.00 | 4,216 | 100.00 | 56,299,686 | 100.00 |
5.2 Distribution Schedule of the Number of Holders and Percentage of Holding in each Class of Equity Securities
(As per Rule No. 7.6 (x) of the Listing Rules of the CSE)
| As at December 31, 2016 | As at December 31, 2015 | |||||||||
| No. of Shareholders | % | No. of Shares | % | No. of Shareholders | % | No. of Shares | % | |||
| Ordinary Shares Voting | ||||||||||
| 1 | – | 1,000 | 4,827 | 50.23 | 1,107,910 | 0.13 | 4,683 | 49.77 | 1,187,812 | 0.14 |
| 1,001 | – | 10,000 | 3,081 | 32.06 | 11,064,002 | 1.33 | 3,014 | 32.02 | 11,163,309 | 1.36 |
| 10,001 | – | 100,000 | 1,406 | 14.63 | 40,096,730 | 4.81 | 1,432 | 15.21 | 41,917,942 | 5.11 |
| 100,001 | – | 1,000,000 | 227 | 2.36 | 63,821,779 | 7.66 | 211 | 2.24 | 59,390,754 | 7.24 |
| Over | 1,000,000 | 69 | 0.72 | 717,431,466 | 86.07 | 72 | 0.76 | 706,907,298 | 86.15 | |
| Total | 9,610 | 100.00 | 833,521,887 | 100.00 | 9,412 | 100.00 | 820,567,115 | 100.00 | ||
| Ordinary Shares Non-Voting | ||||||||||
| 1 | – | 1,000 | 2,248 | 53.64 | 544,686 | 0.94 | 2,235 | 53.01 | 567,113 | 1.00 |
| 1,001 | – | 10,000 | 1,354 | 32.30 | 4,513,800 | 7.89 | 1,370 | 32.50 | 4,474,887 | 7.95 |
| 10,001 | – | 100,000 | 492 | 11.74 | 13,932,010 | 24.35 | 506 | 12.00 | 13,724,725 | 24.38 |
| 100,001 | – | 1,000,000 | 90 | 2.15 | 21,600,494 | 37.77 | 98 | 2.32 | 23,079,473 | 41.00 |
| Over | 1,000,000 | 7 | 0.17 | 16,621,663 | 29.05 | 7 | 0.17 | 14,453,488 | 25.67 | |
| Total | 4,191 | 100.00 | 57,212,653 | 100.00 | 4,216 | 100.00 | 56,299,686 | 100.00 | ||
5.3 The Names, Number and Percentage of Shares Held by Twenty Largest Shareholders
(As per Rule No. 7.6 (iii) of the Listing Rules of the CSE)
| As at December 31, | 2016 | 2015 (*) | ||||
| Ordinary Shares-Voting | No. of Shares | % | No. of Shares | % | ||
| 1. | DFCC Bank A/C 1 | 122,747,994 | 14.73 | 121,005,515 | 14.75 | |
| 2. | Mr. Y.S.H.I. Silva | 82,635,230 | 9.91 | 81,388,992 | 9.92 | |
| 3. | Employees’ Provident Fund | 80,741,135 | 9.69 | 79,594,968 | 9.70 | |
| 4. | Sri Lanka Insurance Corporation Ltd. – Life Fund | 41,854,996 | 5.02 | 41,260,840 | 5.03 | |
| 5. | CB NY S/A International Finance Corporation | 37,206,040 | 4.46 | 36,677,879 | 4.47 | |
| 6. | Sri Lanka Insurance Corporation Ltd. – General Fund | 35,989,537 | 4.32 | 35,478,645 | 4.32 | |
| 7. | Melstacorp Ltd. | 28,295,305 | 3.39 | 19,879,375 | 2.42 | |
| 8. | Mrs. L.E.M. Yaseen | 16,603,339 | 1.99 | 15,380,000 | 1.87 | |
| 9. | HSBC International Nominees Ltd. – JPMLU – Franklin Templeton Investment Fund | 14,791,566 | 1.77 | 24,352,909 | 2.97 | |
| 10. | HSBC International Nominees Ltd. – SNFE – NT Asian Discovery Master Fund | 13,929,632 | 1.67 | – | – | |
| 11. |
HSBC International Nominees Ltd. – SSBT – Morgan Stanley Institutional Fund, Inc. Frontier Emerging Markets Portfolio |
12,998,068 | 1.56 | 13,434,182 | 1.64 | |
| 12. | HSBC International Nominees Ltd. – SSBT – Morgan Stanley Asset Management SA Acting on behalf of Morgan Stanley Galaxy Fund | 12,732,186 | 1.53 | 11,731,336 | 1.43 | |
| 13. |
HSBC International Nominees Ltd. – BPSS – LUX – Aberdeen Global Asia Pacific Equity Fund |
11,172,854 | 1.34 | 11,014,249 | 1.34 | |
| 14. | Employee’s Trust Fund Board | 10,723,987 | 1.29 | 6,475,327 | 0.79 | |
| 15. | Mercantile Investments & Finance PLC | 10,661,077 | 1.28 | 10,509,737 | 1.28 | |
| 16. |
HSBC International Nominees Ltd. – BPSS – LUX – Aberdeen Global – Asian Smaller Companies Fund |
9,368,066 | 1.12 | 10,319,466 | 1.26 | |
| 17. |
HSBC International Nominees Ltd. – SSBT – First State Investments ICVC-Stewart Investors Indian Subcontinent Fund |
8,886,230 | 1.07 | 7,037,883 | 0.86 | |
| 18. |
HSBC International Nominees Ltd. – SSBT – BMO Investments II (Ireland) Public Limited Company |
8,522,701 | 1.02 | 7,208,955 | 0.88 | |
| 19. | BNYMSANV RE-CF Ruffer Total Return Fund | 8,399,814 | 1.01 | 8,280,574 | 1.01 | |
| 20. |
HSBC International Nominees Ltd. – BP2S – London – Aberdeen Asia Smaller Companies Investment Trust |
6,944,006 | 0.83 | 6,845,432 | 0.83 | |
| Sub total | 575,203,763 | 69.01 | 547,876,264 | 66.77 | ||
| Other shareholders | 258,318,124 | 30.99 | 272,690,851 | 33.23 | ||
| Total | 833,521,887 | 100.00 | 820,567,115 | 100.00 | ||
As per Rule No. 7.6 (iv) of the Listing Rules of the CSE, percentage of public holding of voting shares as at December 31, 2016
was 99.73% (99.64% as at December 31, 2015).
As per Rule No. 7.13.1 of the Listing Rules of the CSE, number of shareholders representing public holding as at December 31,
2016 – 9,578 (9,383 as at December 31, 2015).
* Comparative shareholdings as at December 31, 2015 of the twenty largest shareholders as at December 31, 2016.
| As at December 31, | 2016 | 2015 (*) | ||||
| Ordinary Shares – Non-Voting | No. of Shares | % | No. of Shares | % | ||
| 1. | Employees’ Trust Fund Board | 4,167,636 | 7.28 | 4,101,132 | 7.28 | |
| 2. | HSBC International Nominees Ltd. – JPMLU – Franklin Templeton Investment Fund | 3,309,627 | 5.78 | 3,256,814 | 5.78 | |
| 3. | Citi Bank NY S/A Norges Bank Accounts 2 | 3,228,072 | 5.64 | 1,265,623 | 2.25 | |
| 4. | CB NY S/A Salient International Dividend Signal Fund | 1,802,572 | 3.15 | 1,781,807 | 3.16 | |
| 5. | GF Capital Global Ltd. | 1,591,203 | 2.78 | 1,565,812 | 2.78 | |
| 6. | BNYMSANV RE-Butterfield Trust (Bermuda) Ltd. | 1,419,594 | 2.48 | 1,396,941 | 2.48 | |
| 7. | Mr. J.D. Bandaranayake | 1,102,959 | 1.93 | 1,085,359 | 1.93 | |
| 8. | M.J.F. Exports Ltd. | 978,724 | 1.71 | 963,107 | 1.71 | |
| 9. | Mr. M.F. Hashim | 800,417 | 1.40 | 767,339 | 1.36 | |
| 10. | Saboor Chatoor (Pvt) Ltd. | 781,100 | 1.37 | 763,000 | 1.36 | |
| 11. | Beta Holdings Ltd. | 765,030 | 1.34 | 727,971 | 1.29 | |
| 12. | Mrs. L.V.C. Samarasinha | 650,000 | 1.14 | 607,769 | 1.08 | |
| 13. | Union Assurance PLC – No – 01A/C | 581,706 | 1.02 | 572,424 | 1.02 | |
| 14. | Akbar Brothers (Pvt) Ltd. A/C No 1 | 576,809 | 1.01 | 567,605 | 1.01 | |
| 15. | Dr. A.K.A. Jayawardene | 505,035 | 0.88 | 496,976 | 0.88 | |
| 16. | Mr. J.G. De Mel | 485,284 | 0.85 | 420,000 | 0.75 | |
| 17. | Mr. G.R. Mallawaaratchy/Mrs. B.G.P. Mallawaaratchy | 479,764 | 0.84 | 462,309 | 0.82 | |
| 18. | Mr. W.R.H.Perera | 452,051 | 0.79 | 444,838 | 0.79 | |
| 19. | Mr. T.W.A. Wickamasinghe | 436,759 | 0.76 | 335,000 | 0.60 | |
| 20. | Alpex Marine (Pvt) Ltd. | 430,605 | 0.75 | 423,734 | 0.75 | |
| Sub total | 24,544,947 | 42.90 | 22,005,560 | 39.08 | ||
| Other shareholders | 32,667,706 | 57.10 | 34,294,126 | 60.92 | ||
| Total | 57,212,653 | 100.00 | 56,299,686 | 100.00 | ||
As per Rule No. 7.6 (iv) of the Listing Rules of the CSE, percentage of public holding of non-voting shares as at December 31, 2016
was 99.79% (99.79% as at December 31, 2015).
As per Rule No. 7.13.1 of the Listing Rules of the CSE, number of shareholders representing public holding as at December 31,
2016 – 4,182 (4,207 as at December 31, 2015).
* Comparative shareholdings as at December 31, 2015 of the twenty largest shareholders as at December 31, 2016.
5.4 Directors’ Shareholding Including the Chief Executive Officer’s Shareholding
(As per Rule No. 7.6 (v) of the Listing Rules of the CSE)
| Ordinary Shares-Voting | Ordinary Shares-Non-Voting | |||
| As at December 31, | 2016 | 2015 | 2016 | 2015 |
| Mr. K.G.D.D. Dheerasinghe – Chairman | 21,159 | 20,859 | Nil | Nil |
| Mr. M.P. Jayawardena – Deputy Chairman | Nil | Nil | Nil | Nil |
| Mr. J. Durairatnam – MD/CEO | 470,770 | 412,056 | Nil | Nil |
| Mr. S. Swarnajothi | Nil | Nil | 8,738 | 8,599 |
| Mr. S. Renganathan | 197,647 | 191,936 | 10,488 | 10,321 |
| Prof. A.K.W. Jayawardane | Nil | Nil | Nil | Nil |
| Mr. K. Dharmasiri | Nil | Nil | Nil | Nil |
| Mr. L.D. Niyangoda (appointed w.e.f. August 26, 2016) | Nil | N/A | Nil | N/A |
| Ms. N.T.M.S. Cooray (appointed w.e.f. September 19, 2016) | Nil | N/A | Nil | N/A |
| Mr. G.S. Jadeja (appointed w.e.f. September 19, 2016) | Nil | N/A | Nil | N/A |
| Mr. H.J. Wilson (resigned w.e.f. August 29, 2016) | N/A | Nil | N/A | Nil |
6. Engaging with Shareholders
The Bank has a shareholder communication policy enumerating formal channels for engagement with shareholders which has been complied with during the year. This covers the timely communication of quarterly performance set out from page 117 to 119 and significant events that are reasonably expected to impact the share price. Please refer to the Financial Calendar set out on page 179 for more details.
7. Material Foreseeable Risk Factors
(As per Rule No. 7.6 (VI) of the Listing Rules of the CSE)
Information pertaining to the material foreseeable risk factors, that require disclosures as per the Rule No. 7.6 (vi) of the Listing Rules
of the CSE are discussed in the Section on ‘Managing Risk: An Overview’ on pages 172 to 175.
8. Material Issues Pertaining to Employees and Industrial Relations Pertaining to the Bank
(As per Rule No. 7.6 (VII) of the Listing Rules of the CSE)
There were no material issues pertaining to employees and industrial relations pertaining to the Bank that occurred during the year under review which require disclosure.
9. Quarterly Performance – 2016 Compared to 2015
The Bank duly submitted the Interim Financial Statements for the year 2016 to the CSE within applicable statutory deadlines as required by the Rule No. 7.4 (a) (i) of the Listing Rules of the CSE. (The Bank duly complied with this requirement for 2015).
The Audited Income Statement for the year ended December 31, 2016 and the Audited Statement of Financial Position as at December 31, 2016 will be submitted to the CSE within three months from the year end, which is well within the required deadline as required by the Rule No. 7.5 (a) of the Listing Rules of the CSE (The Bank duly complied with this requirement for 2015).
The full Annual Report together with Audited Financial Statements and the Interim Financial Statements are available on the Bank’s website (http://www.combank.lk/newweb/investor-relations). Alternatively, shareholders are able to elect to receive a mailed hard copy of the Annual Report on request. The Company Secretary of the Bank will respond to individual letters received from shareholders.
Summary of the Income Statement
| 2016 | 2015 | |||||||||
| 1st Quarter Mar. 31 | 2nd Quarter Jun. 30 | 3rd Quarter Sep. 30 | 4th Quarter Dec. 31 | Total | 1st Quarter Mar. 31 | 2nd Quarter Jun. 30 | 3rd Quarter Sep. 30 | 4th Quarter Dec. 31 | Total | |
| Rs. Mn. | Rs. Mn. | Rs. Mn. | Rs. Mn. | Rs. Mn. | Rs. Mn. | Rs. Mn. | Rs. Mn. | Rs. Mn. | Rs. Mn. | |
| Group | ||||||||||
| Net interest income | 8,173.1 | 8,065.6 | 8,223.6 | 8,665.9 | 33,128.2 | 7,286.0 | 7,588.9 | 7,681.0 | 8,011.5 | 30,567.4 |
|
Net fee and commission income |
1,463.0 | 1,515.6 | 1,805.5 | 2,305.1 | 7,089.2 | 1,258.1 | 1,219.5 | 1,335.4 | 1,597.3 | 5,410.3 |
|
Other operating income (Net) |
1,429.1 | 496.7 | 1,080.1 | 1,174.9 | 4,180.8 | 1,213.2 | 527.1 | 1,889.4 | 1,926.5 | 5,556.2 |
|
Less: Impairment charges for loans and other losses |
1,000.3 | 567.7 | 252.8 | (237.5) | 1,583.3 | 1,334.2 | 753.7 | 1,097.0 | 914.9 | 4,099.8 |
| Net operating income | 10,064.9 | 9,510.2 | 10,856.4 | 12,383.4 | 42,814.9 | 8,423.1 | 8,581.8 | 9,808.8 | 10,620.4 | 37,434.1 |
| Less: Expenses | 5,425.7 | 5,174.7 | 5,830.6 | 6,275.8 | 22,706.8 | 4,792.8 | 4,724.3 | 5,071.4 | 5,723.2 | 20,311.7 |
| Operating profit | 4,639.2 | 4,335.5 | 5,025.8 | 6,107.6 | 20,108.1 | 3,630.3 | 3,857.5 | 4,737.4 | 4,897.2 | 17,122.4 |
|
Add: Share of profits/ (losses) of associates |
0.8 | 1.2 | 3.8 | 0.7 | 6.5 | 2.3 | 2.8 | 4.8 | 3.7 | 13.6 |
| Profit before income tax | 4,640.0 | 4,336.7 | 5,029.6 | 6,108.3 | 20,114.6 | 3,632.6 | 3,860.3 | 4,742.2 | 4,900.9 | 17,136.0 |
| Less: Income tax expense | 1,376.5 | 1,083.3 | 1,351.5 | 1,836.9 | 5,648.2 | 1,095.7 | 1,213.3 | 1,491.4 | 1,476.4 | 5,276.8 |
| Profit for the period | 3,263.5 | 3,253.4 | 3,678.1 | 4,271.4 | 14,466.4 | 2,536.9 | 2,647.0 | 3,250.8 | 3,424.5 | 11,859.2 |
|
Quarterly profit as a % of the profit after tax |
22.6 | 22.5 | 25.4 | 29.5 | 100.0 | 21.4 | 22.3 | 27.4 | 28.9 | 100.0 |
|
Cumulative quarterly profit as a % of the profit after tax |
22.6 | 45.0 | 70.5 | 100.0 | 21.4 | 43.7 | 71.1 | 100.0 | ||
| Bank | ||||||||||
| Net interest income | 8,112.9 | 7,997.9 | 8,144.3 | 8,568.5 | 32,823.6 | 7,232.7 | 7,534.9 | 7,630.2 | 7,947.8 | 30,345.6 |
|
Net fee and commission income |
1,460.0 | 1,508.9 | 1,798.1 | 2,248.5 | 7,015.5 | 1,256.4 | 1,217.5 | 1,333.3 | 1,566.8 | 5,374.0 |
|
Other operating income (Net) |
1,405.8 | 496.6 | 1,077.6 | 1,281.4 | 4,261.4 | 1,192.6 | 543.2 | 1,889.2 | 1,937.2 | 5,562.2 |
|
Less: Impairment charges for loans and other losses |
995.0 | 551.2 | 257.4 | (273.8) | 1,529.8 | 1,329.7 | 729.9 | 1,055.6 | 828.0 | 3,943.2 |
| Net operating income | 9,983.7 | 9,452.2 | 10,762.6 | 12,372.2 | 42,570.7 | 8,352.0 | 8,565.7 | 9,797.1 | 10,623.8 | 37,338.6 |
| Less: Expenses | 5,404.0 | 5,136.4 | 5,770.9 | 6,208.2 | 22,519.5 | 4,772.8 | 4,701.8 | 5,049.7 | 5,670.7 | 20,195.0 |
| Profit before income tax | 4,579.7 | 4,315.8 | 4,991.7 | 6,164.0 | 20,051.2 | 3,579.2 | 3,863.9 | 4,747.4 | 4,953.1 | 17,143.6 |
| Less: Income tax expense | 1,345.2 | 1,062.1 | 1,328.5 | 1,802.9 | 5,538.7 | 1,070.5 | 1,204.6 | 1,489.4 | 1,475.9 | 5,240.4 |
| Profit for the period | 3,234.5 | 3,253.7 | 3,663.2 | 4,361.1 | 14,512.5 | 2,508.7 | 2,659.3 | 3,258.0 | 3,477.2 | 11,903.2 |
|
Quarterly profit as a % of the profit after tax |
22.3 | 22.4 | 25.2 | 30.1 | 100.0 | 21.1 | 22.3 | 27.4 | 29.2 | 100.0 |
|
Cumulative quarterly profit as a % of the profit after tax |
22.3 | 44.7 | 69.9 | 100.0 | 21.1 | 43.4 | 70.8 | 100.0 | ||
Summary of Statements of Financial Position
| 2016 | 2015 | |||||||
| As at | Mar. 31 | Jun. 30 | Sep. 30 | Dec. 31 | Mar. 31 | Jun. 30 | Sep. 30 | Dec. 31 |
| Rs. Mn. | Rs. Mn. | Rs. Mn. | Rs. Mn. | Rs. Mn. | Rs. Mn. | Rs. Mn. | Rs. Mn. | |
| Group | ||||||||
| Cash and cash equivalents | 26,041.8 | 33,510.9 | 26,332.8 | 32,924.2 | 25,668.2 | 26,117.8 | 19,311.9 | 20,107.1 |
| Placements with banks | 4,301.3 | 8,426.8 | 14,061.6 | 11,718.5 | 13,275.0 | 6,149.5 | 10,362.5 | 17,193.5 |
| Securities purchased under resale agreements | 9,002.0 | 80.0 | 350.1 | – | 10,266.1 | 6,001.0 | 1,944.4 | 8,002.1 |
| Other financial assets – Held-for-trading | 10,539.6 | 8,670.5 | 12,085.4 | 4,987.8 | 9,501.5 | 12,392.0 | 12,624.0 | 7,656.3 |
|
Loans and receivables to banks and other customers |
539,906.8 | 554,878.6 | 578,642.4 | 620,753.9 | 439,122.3 | 456,915.4 | 484,416.1 | 509,923.1 |
| Financial investments – Available-for-sale | 168,306.5 | 168,810.7 | 171,516.3 | 160,092.5 | 215,671.3 | 206,166.1 | 236,351.0 | 204,262.0 |
| Financial investments – Held-to-maturity | 35,911.1 | 36,124.7 | 37,001.2 | 63,626.6 | – | – | – | – |
| Financial investments – Loans and receivables | 66,464.2 | 61,741.8 | 52,060.8 | 51,824.0 | 50,249.3 | 50,684.2 | 58,030.1 | 57,724.4 |
| Other assets | 66,641.6 | 61,250.5 | 65,741.8 | 75,056.1 | 45,719.8 | 51,481.1 | 52,391.1 | 57,314.7 |
| 927,114.9 | 933,494.5 | 957,792.4 | 1,020,983.6 | 809,473.5 | 815,907.1 | 875,431.1 | 882,183.2 | |
| Due to banks | 39,095.2 | 36,937.4 | 33,417.8 | 71,098.4 | 30,445.8 | 16,008.3 | 34,661.1 | 31,789.4 |
| Securities sold under resale agreements | 115,628.0 | 95,083.4 | 87,040.9 | 69,629.0 | 115,936.1 | 119,539.1 | 137,403.1 | 112,249.7 |
| Due to other customers/deposits from customers | 652,934.5 | 679,948.2 | 710,389.5 | 743,310.6 | 549,003.3 | 568,954.3 | 588,803.5 | 624,021.2 |
| Other borrowings | 9,881.9 | 9,603.9 | 9,578.5 | 9,270.2 | 11,359.3 | 10,116.4 | 10,045.9 | 9,985.6 |
| Subordinated liabilities | 18,541.0 | 17,957.8 | 17,979.1 | 24,849.5 | 11,415.0 | 11,324.1 | 12,106.1 | 11,988.3 |
| Other liabilities | 25,475.6 | 23,169.4 | 22,093.6 | 23,010.5 | 24,734.5 | 18,943.3 | 21,078.3 | 21,135.2 |
| Shareholders’ funds | 65,558.7 | 70,794.4 | 77,293.0 | 79,815.4 | 66,579.5 | 71,021.6 | 71,333.1 | 71,013.8 |
| 927,114.9 | 933,494.5 | 957,792.4 | 1,020,983.6 | 809,473.5 | 815,907.1 | 875,431.1 | 882,183.2 | |
| Quarterly Growth (%) | ||||||||
|
Loans and receivables to banks and other customers |
5.88 | 2.77 | 4.28 | 7.28 | 8.02 | 4.05 | 6.02 | 5.27 |
| Due to other customers/deposits from customers | 4.63 | 4.14 | 4.48 | 4.63 | 3.73 | 3.63 | 3.49 | 5.98 |
| Total assets | 5.09 | 0.69 | 2.60 | 6.60 | 1.53 | 0.79 | 7.30 | 0.77 |
| 2016 | 2015 | |||||||
| As at | Mar. 31 | Jun. 30 | Sep. 30 | Dec. 31 | Mar. 31 | Jun. 30 | Sep. 30 | Dec. 31 |
| Rs. Mn. | Rs. Mn. | Rs. Mn. | Rs. Mn. | Rs. Mn. | Rs. Mn. | Rs. Mn. | Rs. Mn. | |
| Bank | ||||||||
| Cash and cash equivalents | 25,995.1 | 33,475.1 | 24,647.9 | 30,193.6 | 25,640.4 | 26,097.7 | 19,286.7 | 20,043.5 |
| Placements with banks | 4,301.3 | 8,426.8 | 14,061.6 | 11,718.5 | 13,275.0 | 6,149.5 | 10,362.5 | 17,193.5 |
| Securities purchased under resale agreements | 9,002.0 | 80.0 | 350.1 | – | 10,266.1 | 6,001.0 | 1,944.4 | 8,002.1 |
| Other financial assets – Held-for-trading | 10,539.6 | 8,670.5 | 12,085.4 | 4,987.8 | 9,501.5 | 12,392.0 | 12,624.0 | 7,656.3 |
|
Loans and receivables to banks and other customers |
537,473.3 | 551,891.7 | 575,081.6 | 616,642.7 | 438,037.6 | 455,430.4 | 482,511.5 | 508,716.2 |
| Financial investments – Available-for-sale | 168,288.5 | 168,741.5 | 171,446.0 | 160,023.5 | 215,654.5 | 206,149.1 | 236,333.6 | 204,244.3 |
| Financial investments – Held-to-maturity | 35,911.1 | 36,124.7 | 37,001.2 | 60,981.3 | – | – | – | – |
| Financial investments – Loans and receivables | 66,464.2 | 61,741.8 | 52,060.8 | 51,824.0 | 50,249.3 | 50,684.2 | 58,030.1 | 57,724.4 |
| Other assets | 66,599.5 | 61,222.2 | 66,564 | 75,829.8 | 45,227.5 | 50,937.1 | 51,830.2 | 56,224.8 |
| 924,574.6 | 930,374.3 | 953,298.6 | 1,012,201.2 | 807,851.9 | 813,841.0 | 872,923.0 | 879,805.1 | |
| Due to banks | 37,185.2 | 34,401.0 | 30,419.2 | 67,608.8 | 30,069.9 | 15,174.1 | 33,373.7 | 30,319.1 |
| Securities sold under resale agreements | 115,831.1 | 95,288.0 | 87,275.7 | 69,867.5 | 116,096.1 | 119,679.7 | 137,535.5 | 112,384.8 |
| Due to other customers | 653,039.5 | 680,057.5 | 710,457.9 | 739,563.5 | 549,111.2 | 569,082.1 | 588,917.5 | 624,101.8 |
| Other borrowings | 9,881.9 | 9,603.9 | 9,578.5 | 9,270.2 | 11,346.3 | 10,104.4 | 10,045.9 | 9,985.6 |
| Subordinated liabilities | 18,526.0 | 17,942.8 | 17,979.1 | 24,849.5 | 11,197.2 | 11,106.3 | 11,888.3 | 11,973.3 |
| Other liabilities | 25,256.2 | 22,989.7 | 21,824.8 | 22,688.0 | 24,215.3 | 18,432.7 | 20,579.4 | 20,699.7 |
| Shareholders’ funds | 64,854.7 | 70,091.4 | 75,763.4 | 78,353.7 | 65,815.9 | 70,261.7 | 70,582.7 | 70,340.8 |
| 924,574.6 | 930,374.3 | 953,298.6 | 1,012,201.2 | 807,851.9 | 813,841.0 | 872,923.0 | 879,805.1 | |
| Quarterly Growth (%) | ||||||||
|
Loans and receivables to banks and other customers |
5.65 | 2.68 | 4.20 | 7.23 | 8.04 | 3.97 | 5.95 | 5.43 |
| Due to other customers/Deposits from customers | 4.64 | 4.14 | 4.47 | 4.10 | 3.73 | 3.64 | 3.49 | 5.97 |
| Total assets | 5.09 | 0.63 | 2.46 | 6.18 | 1.54 | 0.74 | 7.26 | 0.79 |
10. Debt Securities
The Bank had two debenture issues during the year to strengthen its Tier II capital which were over-subscribed. Trading on debentures is minimal with many debenture holders opting to hold on to the instruments until maturity. Market activity on debentures in issue are
as follows:
The price of debentures issued in March 2016 have declined as market interest rates moved up during the year. Debentures issued in October 2016 have maintained their par value as at the close of the year.
(a) Debenture Composition
| Fixed Interest Rate | Floating Interest Rate | |||||||
| 2016 | 2015 | 2016 | 2015 | |||||
| Type of issue | Public | Public | Public | Public | Private | Public | – | Public |
| Debenture type | Type ‘A’ | Type ‘B’ | Type ‘A’ | Type ‘B’ | N/A | Type ‘A’ | – | Type 'D' |
| CSE listing | Listed | Listed | Listed | Listed | Not listed | Listed | – | Listed |
| Issue date | Mar. 2016 | Mar. 2016 | Oct. 2016 | Oct. 2016 | May 2006 | Dec. 2006 | – | Dec 2006 |
| Maturity date | Mar. 2021 | Mar. 2026 | Oct. 2021 | Oct. 2026 | May 2016 | Dec. 2016 | – | Dec 2016 |
| Interest payable frequency | Biannually | Biannually | Biannually | Biannually | Annually | Annually | – | Annually |
| Offered interest rate | 10.75% p.a. | 11.25% p.a. | 12.00% p.a. | 12.25% p.a. | 13.25% p.a. | 14.00% p.a. | – | 12 Months TB Rate (Gross) + 1% p.a. |
| Amount (Rs. Mn.) | 4,430.340 | 1,749.090 | 5,071.800 | 1,928.200 | 505.000 | 467.260 | – | 0.400 |
| Market Values | ||||||||
| - Highest (Rs.) | Not traded during the year | Not traded during the year | Not traded during the year | Not traded during the year | Not traded during the year | Not traded during the year | – | Not traded during the year |
| - Lowest (Rs.) | ||||||||
| - Year-end (Rs.) | ||||||||
| Interest Rates | ||||||||
| - Coupon rate (%) | 10.75 | 11.25 | 12.00 | 12.25 | 13.25 | 14.00 | – | 7.68 |
| - Effective annual yield (%) | 11.04 | 11.57 | 12.36 | 12.63 | 13.25 | 14.00 | – | 7.68 |
|
Interest rate of comparable Government security |
12.05 | 12.45 | 12.15 | 12.50 | 6.65 | 7.60 | – | 9.10 |
| Other Ratios as at Date of Last Trade | ||||||||
| - Interest yield (%) | N/A | N/A | N/A | N/A | N/A | Not traded during the year | – | Not traded during the year |
| - Yield to maturity (%) | N/A | N/A | N/A | N/A | N/A | |||
(b) Other Ratios
| 2016 | 2015 | |
| Debt equity ratio (%) | 37.92 | 23.20 |
| Net assets value per share (Rs.) | 87.97 | 80.22 |
| Interest cover (Times) | 12.77 | 27.87 |
| Liquid assets ratio (%) (Minimum 20%) | 27.41 | 27.72 |
(c) Credit Ratings
- The Bank’s credit rating, AA (lka) was reaffirmed by Fitch Ratings Lanka Ltd. in 2016
- The Bank’s Bangladesh Operation’s credit rating was reaffirmed as AAA by Credit Rating Information Services Ltd. in 2016
(d) Credit Ratings – Debentures
- The credit rating of the Bank’s Subordinated Debentures affirmed in 2016 as AA (lka) by Fitch Ratings Lanka Ltd.
Compliance Report on the Contents of Annual Report in Terms of the Listing Rules of the CSE
We are happy to inform you that the Bank has fully complied with all applicable requirements of the Section 7.6 of the Listing Rules of the CSE on the contents of the Annual Report and Accounts of a listed entity.
The table below provides reference to the relevant sections of this Annual Report where specified information is disclosed together with page references for the convenience of the readers of the Annual Report.
| Rule No. | Disclosure Requirement | Section/Reference | Page/s |
| 7.6 (i) | Names of persons who held the position of Directors during the financial year |
|
159 |
| 7.6 (ii) | Principal activities of the Bank and its Subsidiaries during the year and any changes therein |
|
191 & 192 442 |
| 7.6 (iii) |
The names and the number of shares held by the 20 largest holders of voting and non-voting shares and the percentage of such shares held as at the end of the year |
|
114 & 115 |
| 7.6 (iv) | The public holding percentage |
|
114 & 115 |
| 7.6 (v) | Directors’ and Chief Executive Officer’s holding in shares at the beginning and at the end of the financial year |
|
116 153-163 |
| 7.6 (vi) | Information pertaining to material foreseeable risk factors |
|
116 |
| 7.6 (vii) | Details of material issues pertaining to employees and industrial relations |
|
116 |
| 7.6 (viii) |
Extents, locations, valuations and the number of buildings of the land holdings and investment properties as at the end of the year |
|
270-275 |
| 7.6 (ix) | Number of shares representing the stated capital as at the end of the year |
|
296 & 297 110-112 |
| 7.6 (x) | A distribution schedule of the number of holders in each class of equity securities and the percentage of their total holdings as at the end of the year |
|
113 |
| 7.6 (xi) |
Ratios and market price information:
|
|
108, 112 & 120 120 121 |
| 7.6 (xii) | Significant changes in the Bank or its Subsidiaries fixed assets and the market value of land, if the value differs substantially from the book value as at the end of the year |
|
271-275 |
| 7.6 (xiii) | Details of funds raised through Public Issues, Rights Issues and Private Placements during the year |
|
296 & 297 |
| 7.6 (xiv) | Information in respect of Employee Share Option Schemes | ||
|
|
297 & 298-300 | |
|
|
108 | |
| 7.6 (xv) |
Disclosures pertaining to Corporate Governance practices in terms of Rules 7.10.3, 7.10.5 (c) and 7.10.6 (c) of Section 7 of the Listing Rules |
|
|
| 7.6 (xvi) | Disclosures on Related Party Transactions exceeding 10% of the Equity or 5% of the total assets of the Entity as per Audited Financial Statements, whichever is lower |
|