Annex 2: Risk and Capital Management Report
Enabling performance and safeguarding business
Managing Risk
Risk management continues to increase in significance and complexity as technology, regulation and banking operations evolve at a rapid pace. It is an integral part of the Bank’s value creation model as we accept risk in the normal course of business. Our stability and profitability are determined by how we manage risk. Significant resources are devoted to this critical function to ensure that it is articulated, communicated and understood by all employees of the Bank as it is a shared responsibility. It is a dynamic and disciplined function based on the triad of Credit, Market and Operational Risk in compliance with the Basel requirements increasing in sophistication with time and subject to stringent oversight by regulators. Risk management continues to evolve at the Bank in line with a Board approved roadmap in the direction of achieving a fully-fledged Enterprise Risk Management System in time to come. A comprehensive risk governance framework facilitates identification, assessment, monitoring and controlling risks within the Bank’s defined risk appetite. The overarching objective is to ensure that risks accepted are in line with the Bank’s risk appetite and strategic priorities and that there is an appropriate trade-off between risk and reward enabling delivery of value to key stakeholders.
A robust risk management framework supports our business strategy which is more-fully described in the Section ‘Managing Risk: An Overview’ on page 172. The Risk Appetite Statement (RAS), which is a key component of the framework, identifies key sources of risk as:
- Macroeconomic, macro-prudential and regulatory risks which are beyond our control, but impact our business directly
- Risks that we accept as a necessary part of our business for which parameters are defined
Risks beyond our control are closely monitored and play a key role in determining strategy while risks accepted as part of our business are monitored as part of key performance indicators or strategic deliverables and are the focus of the risk management function. Key risk metrics which form part of the RAS are summarised below:
| Aspect | Measure | Risk Appetite (%) | 2016 (%) | |||
| Returns | ROA | > 2 | 1.53 | |||
| Capital | CAR | |||||
| Tier I | > 8 | 11.56 | ||||
| Total Capital | > 13.5 | 15.89 | ||||
| Liquidity | SLAR | 22 | 27.41 | |||
| Asset quality downgrade | Gross NPA | 4-5 | 2.18 |
 Table 26
The Board of Directors has ultimate responsibility for managing risk and has delegated oversight responsibility to the BIRMC which reports on risk at regular meetings of the Board. Risk is accepted, monitored and managed by the business units which report to the CEO forming the first line of defence. The risk management function independently monitors risk on an aggregate basis and promulgates policies and guidelines for effective management of risk. Reporting directly to the BIRMC, the risk management function constitutes the second line of defence. Assurance over the first and second lines of defence is provided by Internal Audit which report directly to the BAC forming the third line of defence, together with external audit. This structure facilitates constructive challenge of the balance between risk and reward which is necessary for effective risk management.
Summary of Key Risks
While we track numerous externally driven and internally managed risks, a few become more relevant and increase in significance at times. The list is dynamic and reviewed regularly to ensure it reflects the key risks facing the Bank at present and those that are likely to emerge as key risks. These risks and mitigatory measures available are summarised below:
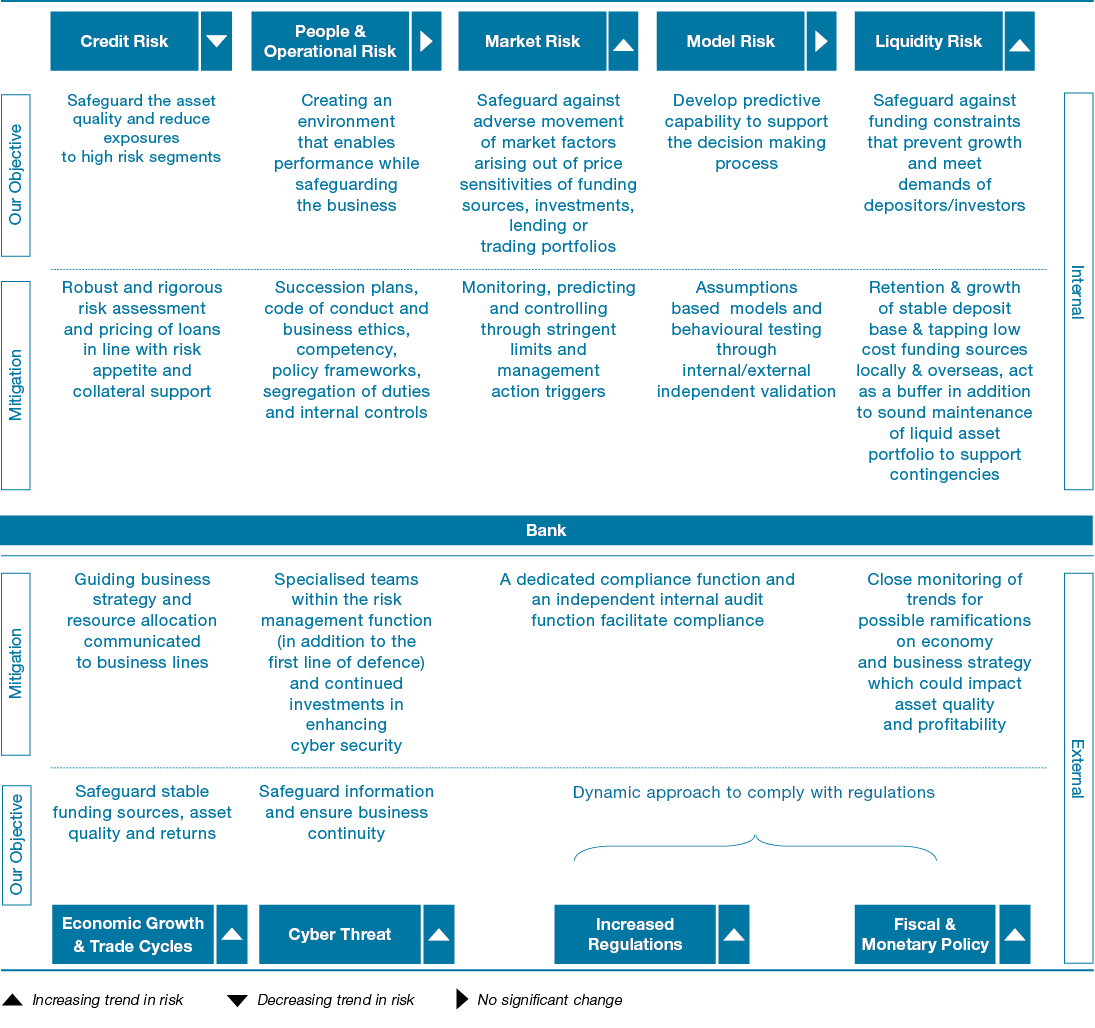
 Figure 33
Comparison of Exposures with Risk Policy Parameters as at December 31, 2016
| Risk Category & Parameter | Description | Policy Parameter | Actual Position | |||
| Credit Risk Criteria | ||||||
| Quality of the Lending Portfolio |
Gross NPA Ratio | 4%-5% | 2.18% | |||
| Net NPA Ratio | 2.5% – 3.5% | 1.09% | ||||
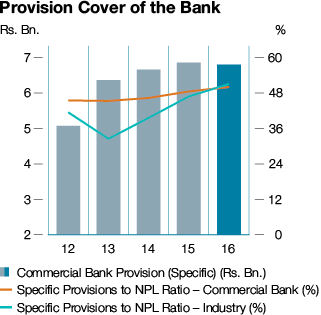
| Provision Cover | 30% – 40% | 50.11% | ||||
| Weighted Average Rating Score of the overall lending portfolios to be above | 35% – 45% | 56.84% | ||||
| Concentration | Loans and Advances by Product (using HHI) | 0.15 – 0.20 | 0.176 | |||
| Advances by Economic sub-sector (using FRB) (using HHI) | 0.015 – 0.025 | 0.0158 | ||||
| Exposures exceeding 5% of the Eligible Capital (using HHI) | 0.05 – 0.10 | 0.0061 | ||||
| Exposures exceeding 15% of the Eligible Capital (using HHI) | 0.10 – 0.20 | 0.0075 | ||||
| Exposure to any sub-sector (SIC) to be maintained at | 4% – 5% | 3.97% | ||||
| Aggregate of exposures exceeding 15% of the Eligible Capital | 20% – 30% | 20.55% | ||||
| Cross border exposure | Rating of the exposure of the portfolio on S & P Investment Grade – AAA to BBB |
AA | AAA | |||
| Market Risk Criteria | ||||||
| Interest Rate Risk | Interest Rate Shock: (Impact to NII as a result of 100bps parallel rate shock) | Maximum of Rs. 1,890 Mn. | Rs. 670.86 Mn. | |||
| Re-pricing Gaps (RSA/RSL in each maturity bucket – up to 1 year period) | < 1.5 (Times) | 2.40 (Times) | ||||
| Strategic Risk Criteria | Capital Adequacy Ratio | |||||
| Tier I | Over 8% | 11.56% | ||||
| Total Capital | Over 13.5% | 15.89% | ||||
| ROE | Over 20% | 16.90% | ||||
| Creditworthiness – Fitch Rating | AA (lka) | AA (lka) |
Table 27
Risk Management Tools
Risk management tools are an integral part of an effective risk management framework, supporting strategy and business planning.
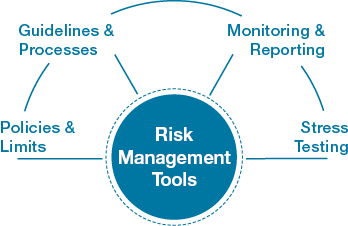
Figure 34
Policies and Limits
The Bank’s Risk Management Policy is comprehensive, addressing the risks managed by the Bank encompassing compliance with the regulatory requirements including the Banking Act Direction No. 07 of 2011 – Integrated Risk Management Framework for Licensed Commercial Banks based on the Basel Framework. This key document clearly defines the objectives, outlines priorities and processes and roles of the Board and Management in managing risk, shaping the risk culture of the Bank. The RAS sets out the limits for risks and forms an integral part of the risk management framework. The RAS and all risk policies are reviewed by the BIRMC at least annually or more frequently depending on the regulatory
and business needs.
The overall Bank exposure including overseas operations is compliant with the regulatory framework of the CBSL. Additionally, the risk management framework takes into account the regulatory requirements of countries
where we operate to facilitate compliance with the same.
Guidelines and Processes
Guidelines facilitate implementation of policies and limits with operational detail including specification of types of facilities, processes and terms and conditions
under which the Bank will conduct business providing employees clarity in their day-to-day work.
Monitoring and Reporting
Risk measurement, monitoring and reporting are the responsibilities of the
risk management function which undergoes regular training programmes to develop and refine their skills. They are well-supported by IT systems which enable extraction of data, analysis and modelling. Regular and ad hoc reports are generated for review by Senior Management, Management Committees and Board which rely on these for evaluating performance and providing strategic direction. The reports provide information on aggregate measures of risks across products and portfolios which are compared to agreed policy limits providing a clear picture of the amounts, types and sensitivities of the risks taken by the Bank.
Stress Testing
Stress testing is carried out at individual risk level and at entity level to estimate the potential impact on income, capital and liquidity position as a result of changes in market conditions and other risk factors. Results of stress testing are used for decision making processes for credit risk appetite, market risk limits, capital and funding and are also integrated into the strategic and financial planning processes. Development, approval and review of stress tests are the responsibility of the EIRMC and the BIRMC.
Risks
The Bank is exposed to risks which have the potential to impact the Bank’s ability to achieve agreed strategic goals including the financial performance. While some risks can be managed by the Bank, there are other key risks that need to be monitored to assess their impacts as described in the adjacent Figure 35.
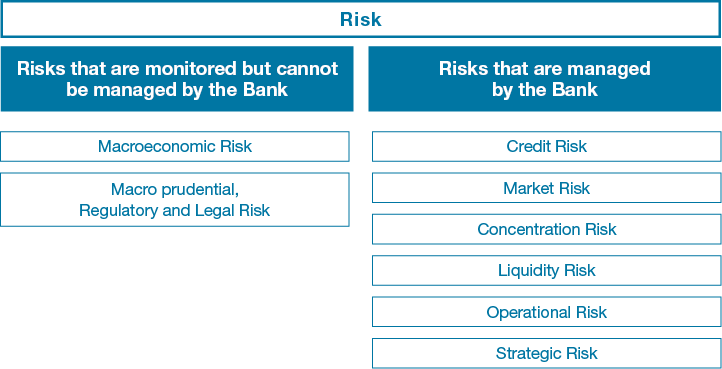
Figure 35
Macroeconomic Risks
The economic and market conditions of the countries we operate in have a direct impact on our performance but such risks cannot be managed by the Bank. These include global economic growth particularly in principal import/export markets for Sri Lanka, geo-political risks impacting principal trading partners, commodities markets which impact sovereign corporate earnings and external trade and structural reforms to regulate or stimulate economic activity including Fiscal and Monetary Policy.
Macro-Prudential, Regulatory
and Legal Risks
The Risk Management Committees receive regular reports on trends and analysis of these risks to support decision making at operational and strategic levels. Key risks monitored include developments in the financial services sector both locally and globally that give rise to increased regulation in Banking sector, increased regulation of the financial services sector and tax-related risks in the countries we operate.
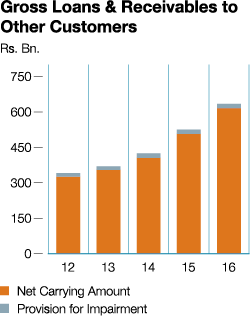
20.00% YoY growth in Gross Loans & Receivables to Other Customers amidst severe competition
 Graph 71
Credit Risk
Credit Risk is the risk of potential loss resulting from the failure of a customer/borrower or counterparty to honour its financial or contractual obligations to the Bank. It arises mainly from direct lending activities which are reflected On-Balance Sheet and from Off-Balance Sheet transactions such as Letters of Credit facilities, Guarantees facilities, Documents against Acceptance, etc. Credit risk is composed of counterparty risk, concentration risk and settlement risk.
Maximum Credit Exposure
| Maximum Exposure 2016 | Maximum Exposure 2015 | |||||
| Rs. Mn. | % | Rs. Mn. | % | |||
| Carrying Amount of Credit Exposures | ||||||
| Loans and receivables to other customers | 616,018 | 44.3 | 508,115 | 39.1 | ||
| Loans receivables to banks | 624 | 0.0 | 601 | 0.0 | ||
| Financial investments | 277,817 | 20.0 | 269,625 | 20.8 | ||
| 894,459 | 778,341 | |||||
| Off-Balance Sheet Maximum Exposures | ||||||
| Lending commitments | 131,382 | 9.4 | 153,980 | 11.9 | ||
| Contingencies | 365,854 | 26.3 | 365,875 | 28.2 | ||
| 497,236 | 519,855 | |||||
| Maximum Credit Exposure | 1,391,695 | 100.0 | 1,298,196 | 100.0 | ||
| Individually Impaired loans | 22,102 | 11,747 | ||||
| Impaired loans as a % of gross loans and receivables |
3.49 | 2.23 | ||||
| Provisions for impairment (individual and collective) |
17,373 | 18,052 | ||||
| Net carrying amount of loans and receivables |
616,018 | 508,115 | ||||
| Provisions as a % of gross loans and receivables |
2.74 | 3.43 | ||||
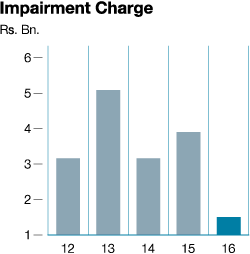
| Loan Impairment Charge (individual and collective) |
1,511 | 3,905 | ||||
Table 28
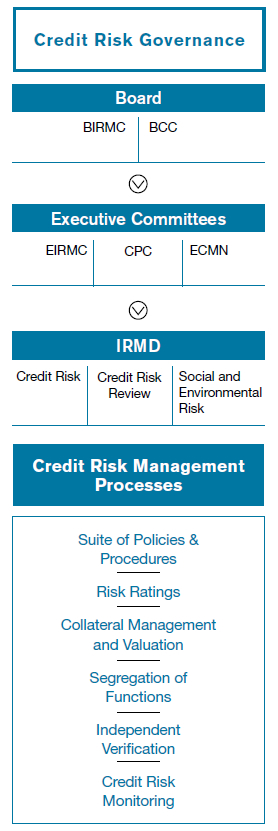
Figure 36
Credit risk commentary focuses primarily on the following:
Overall Credit Exposure
The Bank’s maximum credit exposure increased by 7% in 2016 compared to the previous year. Both retail banking and corporate banking portfolios have contributed to this growth. Individually impaired loans have increased by 88.15% as a result of a policy decision of the Bank to lower the threshold for recognition of individually significant loans.
Since a large number of individually significant loans are subject to rigorous evaluation at the time of being subjected to impairment trigger tests, final provisioning figures reflect a more realistic picture
of the quality of the advances portfolio
of the Bank.
During the year, a reduction of 61.20% is observed in impairment charges compared to the previous year. The combination of moderation of defaults and the high coverage ratio maintained in the past made it permissible to reduce the collective provision coverage within the Bank’s risk appetite. The shift that has taken place in considering a larger number of loans that were previously considered under collective impairment methodology to individually significant provisioning also has contributed to this development.
Graph 72
Management Processes
Management of credit risk is critical to the Bank and our approach is to enhance value through credit risk management going beyond mere regulatory compliance. It is managed through the Credit Risk Management Framework approved by the Board which is summarised graphically in the Figure 36 on page 381.
- A Comprehensive Suite of Policies and Procedures – These comprise the RAS, Delegation of Authority, Credit Risk Review Framework, Social and Environmental Management Systems Policy and Guidelines for valuation of collateral which are reviewed and amended as deemed necessary by the Board based on the recommendations of the CPC and the BCC.
- Risk Ratings – A comprehensive risk rating system compliant with Basel Guidelines representing diverse risk factors through a single point indicator is in place. The indicator uses borrower and transaction specific criteria for predicting the probability of default facilitating measurement of risk in credit portfolios in an objective and consistent manner. It also supports the Bank’s progression from the present Basel II Standardised Approach towards the more advanced Internal Ratings Based approach for calculating the capital requirement for credit risk.
- Collateral Management and
Valuation – The Bank obtains collaterals as a possible secondary recourse in the form of cash, marketable securities, properties, stocks, trade debtors, other receivables, machinery and equipment and other physical or financial assets which are valued in accordance with strict guidelines. A panel of reputed professional valuers appointed by the Bank provides valuations of properties, machinery and vehicles obtained as collateral periodically, ensuring sufficient coverage through collateral. Collaterals vulnerable to frequent fluctuations in values are subject to stringent haircuts and/or more frequent valuations. The Bank also accepts personal and/or Corporate Guarantees, Guarantees from other banks and credit-worthy bodies which are assessed considering the financial strength of guarantors as against their cash flows, net worth etc. - Segregation of Credit Risk Management Functions – Credit risk management comprises of three functional components with pre-sanction risk being monitored and evaluated by Credit Risk Management Function, post-sanction credit risk being monitored by the Credit Risk Review Function and the social and environment risk being monitored by the Environmental Risk Review Function. This facilitates a high degree of specialisation and honing of skills resulting in focused and effective analysis supporting effective credit
risk management. - Independent Verification of Risk Assessments – The Credit Risk Management Unit (CRMU) independently verifies that the proposals with exposures above identified threshold levels fall within the established credit risk framework of the Bank and that they comply with the internal as well as regulatory requirements.
- Credit Risk Monitoring – Branch Credit Monitoring Unit independently monitors the loans and advances portfolio for signs of delinquency and supports Lending Officers in maintaining portfolio quality. CRMU prepares monthly reports on Key Credit Risk Indicators (KCRIs) which include segmentation of the loans and advances portfolio using a number of different parameters enabling the analysis of the portfolio at high level of granularity. KCRI monthly reports also include an in-depth analysis of exposure to the financial subsidiaries thus providing a holistic view of the overall credit risk of the group thereby facilitating identification of emerging risks in individual portfolios and implementation of corrective action in a timely manner.
- Providing Direction to Business Line Managers – The credit monitoring process provides information on products, industries and other indicators of elevated risk facilitating diversification in thriving economic segments whilst reducing the overall credit risk concentration and optimising returns.
- Internal Audit – Credit risk management processes are reviewed by Internal Audit to ensure that they comply with regulatory requirements and the Bank’s policy framework.
38.05% Credit Risk Review CBSL requires 30-40% of the Total Loans & Receivables of the Bank to be subjected to Credit Risk Review (CRR). The Bank has covered 38.05% of the Total Loans and Receivable portfolio under CRR in 2016.
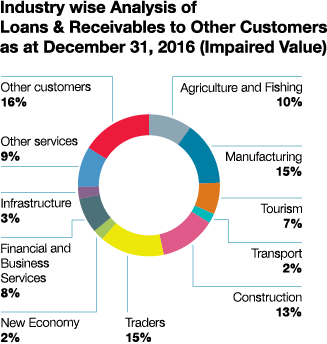
Graph 73
The graph depicts that there is no significant concentration to any industry sector.
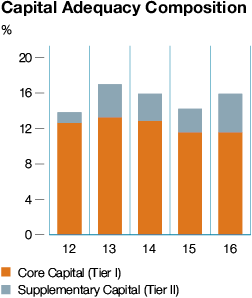
Graph 74
The total capital has increased mainly due to the two debenture issues during the year.
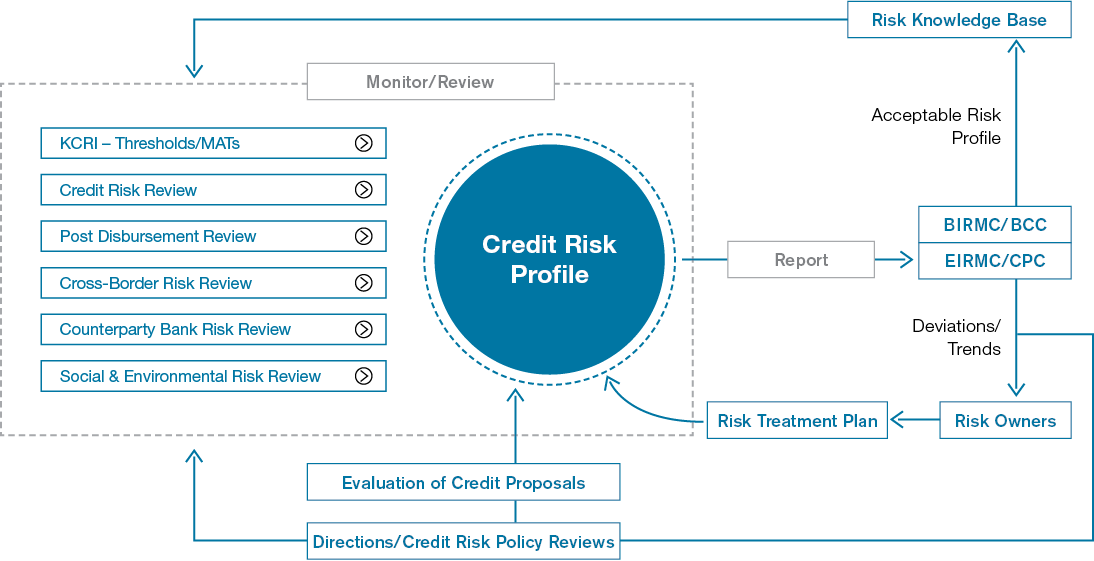
Figure 37
Review of Credit Risk
Default Risk is defined as the risk of potential loss due to borrower/counterparty’s inability or unwillingness to meet its obligations. Elevated levels of attention given to loan approvals and disbursements coupled with concerted efforts in keeping the NPA levels in tandem with the established policy parameters paved the way to improve the asset quality of the Bank.
A more cautious approach in on-boarding high risk segment related exposure, channeling of lending to economically thriving industry sectors, improved risk assessments of credit proposals and effective credit monitoring too have contributed positively in preserving the quality of the loan book.
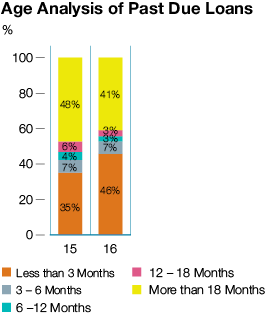
The age analysis of past due loans also supported swift actioning for the moderation of default risk during the year.
The allowance for individually impaired loans increased by 57% whilst the allowance for collective impairment reduced by 29% during the year, distribution of which is given in the
page 384.
Graph 75
Graph 76
Graph 77
Individual/Collective Impairment Distribution – Sri Lanka Operation
| Industry Sector | Past due Advances (According to SLFRS Classification) Rs.'000 | Allowance for Collective Impairment Rs.'000 | Allowance for Individually Impaired Loans Rs.'000 | Amount Written Off Rs.'000 | ||||
| Exports | 3,285,109 | 4,235,707 | 1,765,093 | 3,357 | ||||
| Imports & trading | 3,445,338 | 108,598 | 327,571 | 3,778 | ||||
| Wholesale & retail trading | 1,190,040 | 167,899 | 258,005 | 7,767 | ||||
| Construction industry | 2,257,557 | 124,415 | 33,746 | – | ||||
| Any other commercial activity | 743,689 | 149,908 | 412,911 | 955 | ||||
| Industries – MFG for local market | 5,927,906 | 129,078 | 32,225 | 6,348 | ||||
| Agricultural activity | 2,208,597 | 117,507 | 84,605 | 40,609 | ||||
| Housing and property development | 1,293,380 | 102,183 | 124,826 | 121 | ||||
| Tourism and hospitality trade | 7,776,871 | 123,722 | 109,783 | 211 | ||||
| Personal | 4,925,820 | 104,626 | 39,948 | 71,098 | ||||
| Services | 2,142,280 | 2,159,332 | 4,983,351 | 2,528 | ||||
| Holding companies | 4,862 | – | – | – | ||||
| Finance & insurance industry | 75,582 | – | – | – | ||||
| State institutions | 526 | – | – | – | ||||
| Others | 859,819 | 619,543 | – | 54,726 | ||||
| Total | 36,137,376 | 8,142,517 | 8,172,063 | 191,497 |
Table 29
Individual/Collective Impairment Distribution – Outside of Sri Lanka
| Industry Sector | Past due Advances (According to SLFRS Classification) Rs.'000 | Allowance for Collective Impairment Rs.'000 | Allowance for Individually Impaired Loans Rs.'000 | Amount Written Off Rs.'000 | ||||
Exports |
88,615 | 147,215 | 53,334 | – | ||||
Imports & trading |
10,647 | 17,688 | 6,408 | – | ||||
Wholesale & retail trading |
49,621 | 82,435 | 29,865 | – | ||||
Construction industry |
8,507 | – | – | – | ||||
Any other commercial activity |
96,927 | 85,783 | 31,078 | – | ||||
Industries – MFG for local market |
847,318 | 314,701 | 114,012 | – | ||||
Agricultural activity |
5,523 | 9,175 | 3,324 | – | ||||
Housing and property development |
4,727 | 7,852 | 2,845 | – | ||||
Tourism and hospitality trade |
2,798 | 4,648 | 1,684 | – | ||||
Personal |
14,858 | 10,515 | 3,809 | – | ||||
Services |
87,897 | 21,529 | 7,800 | – | ||||
Holding companies |
79,777 | – | – | – | ||||
Finance & insurance industry |
26,350 | 43,775 | 15,859 | – | ||||
State institutions |
– | – | – | – | ||||
Others |
24,152 | 31,388 | 11,376 | – | ||||
Total |
1,347,718 | 776,705 | 281,394 | – |
Table 30
Concentration Risk
Concentration risk is managed by diversification of risk across industry sectors, products, counterparties and geographies. The Bank’s RAS defines the limits for these segments and exposures are monitored by the Board, BIRMC, EIRMC and the CPC to ensure compliance and also to make recommendations on modifications to specified limits taking into consideration trends and events shaping the business environment. Individual and collective impairment distribution to identified industry sectors as at year end is given in Tables 29 and 30.
An analysis of the loans and receivables by product (Graph 78) also reflects the effectiveness of the Bank’s credit policies with risk being well-diversified across the Bank’s range of credit products with relatively high exposure of 28.3% to
long-term loans which is rigorously monitored and mitigated with collateral.
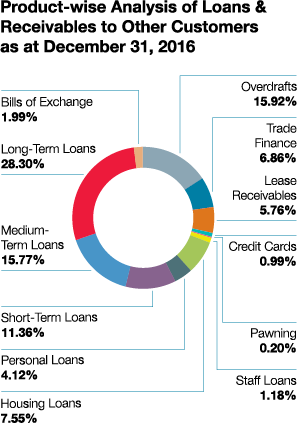
Graph 78
A geographical analysis reflects a high concentration of loans (Graph 79) in the Western Province which is due to concentration of economic activity and the Head Offices of most borrowing entities being located in the Western Province.
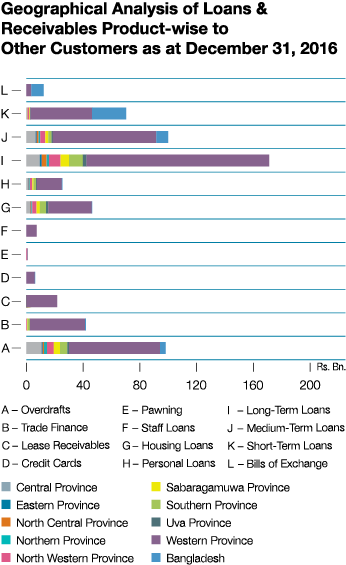
Graph 79
Counterparty Exposures
The Bank has laid down policies/procedures and limit structures including single borrower limits and group exposure limits with sub-limits for products etc. to manage the counterparty risks. The limits set by the Bank are far more stringent compared to the regulator stipulated exposure thresholds for single borrower and group exposure.This provides the Bank with a greater comfort in managing its concentration levels with regard to the counterparty exposures.
A key component in managing counterparty risk is the loans and receivables to banks
both local and foreign where a specific set
of policies, procedures and a limit structure is in place to monitor the exposure to
this segment. At frequent intervals the
counterparty bank exposures are monitored
against the established prudent limits while market information on the financial/economic performance of these counterparties are subject to a rigorous scrutiny throughout the year and the limits will be revised to reflect the latest information where deemed necessary.
Graph 80
Graph 81
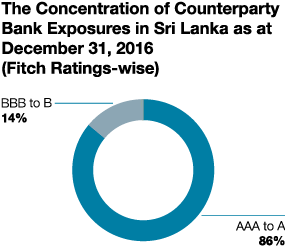
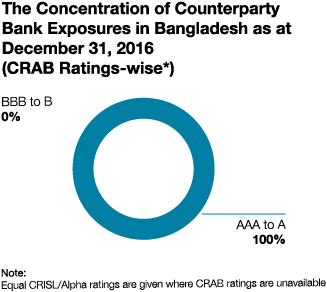
The analysis uses Fitch Ratings for local banks in Sri Lanka and Credit Ratings Agency in Bangladesh (CRAB) for local banks of Bangladesh (Equivalent CRISL/Alpha ratings have been used where CRAB ratings are not available). Exposures for local banks in Sri Lanka rated AAA to A category stood at 86% (Graph 80) while 100% of exposure of local banks in Bangladesh consisted of AAA to A rated counterparty banks (Graph 81).
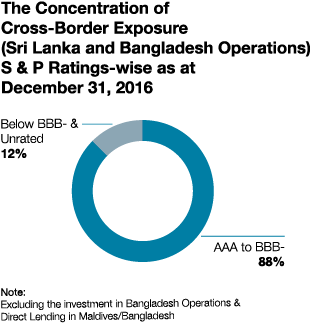
Cross-Border Risk
The risk that Bank will be unable to obtain payment from its customers or third parties on their contractual obligations as a result of certain actions taken by foreign Governments, mainly relating to convertibility and transferability of foreign currency is referred to as the Cross-border Risk. Cross-border assets comprise of loans and advances, interest-bearing deposits with other banks, trade and other bills and acceptances and predominantly relate to short-term money market activities.
In addition to the limit structure in place to minimise risk arising from over concentration and possible settlement risk, Bank carries out stringent evaluations and imposes different threshold levels to facilitate monitoring and timely action to suspend limits to countries due to global economic/political developments when necessary.
Graph 82
Graph 83
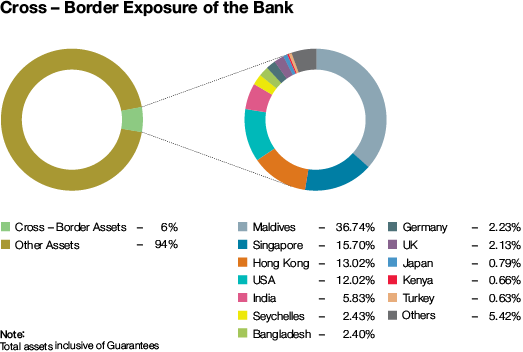
Total cross–border exposure is only 6% of total assets of the Bank (Graph 83). The Bank has exposures to cross–border through a spread of countries which primarily include Maldives, Singapore, Hong Kong, USA, India, etc.
With the start of operations in Maldives through our subsidiary ‘Commercial
Bank of Maldives (CBM)’, group level cross- border exposure measurements are also to be analysed in future. However, as of year-end there are no other additional exposures to this entity, other than the capital investment.
Market Risk
Market Risk is the risk of loss arising from movements in interest rates, foreign exchange rates, commodity prices, equity and debt prices and their correlations. Most of the Bank's operations are subject to at least one or more elements of
market risk.
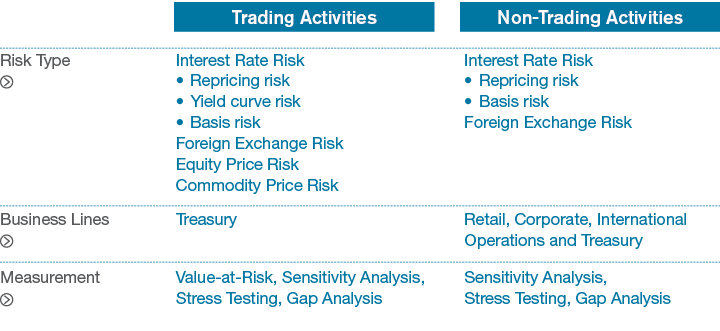
Table 31
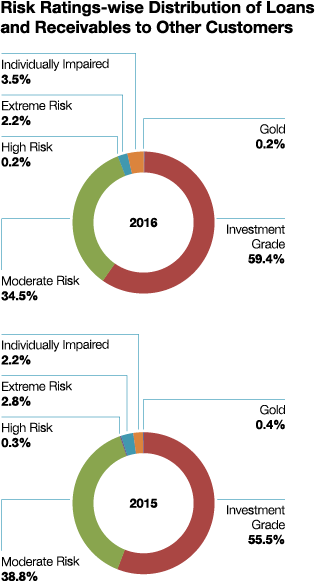
59.60% Distribution of Borrower Ratings Borrowers with Investment Grade Ratings where Default Risk is considered to be very low, comprised 59.60% of the Total Loans and Receivables of the Bank.
88.00% Distribution of Country Rating Exposure to countries which are rated AAA to BBB-(S&P or equivalent) accounted for 88% of the Total Cross-Border exposure of the Bank
Interest Rate Risk (IRR)
Extreme movements in interest rates pose challenges to the Bank’s Net Interest Income (NII) and have the potential to impact the underlying value of interest earning assets and inherent liabilities and Off-Balance Sheet items. The main types of IRR to which the Bank is exposed to are re-pricing risk, yield curve risk and basis risk.
| Major Market Risk Category | Risk Components | Description | Tools to Monitor | Severity | Impact | Exposure | ||||||
| Interest Rate | Risk of loss arising from movements or volatility in interest rates | |||||||||||
| Re-Pricing | Differences in amounts of interest earning assets and interest bearing liabilities getting re-priced at the same time or due to timing differences in the fixed rate maturities and appropriately re-pricing of floating rate assets, liabilities and Off-Balance Sheet instruments |
Re-pricing gap limits and interest rate sensitivity limits | High | High | High | |||||||
| Yield Curve | Unanticipated changes in shape and gradient of the yield curve | Rate shocks and reports | High | High | High | |||||||
| Basis | Differences in the relative movements of rate indices which are used for pricing instruments with similar characteristics | Rate shocks and reports | High | Medium | Medium | |||||||
| Foreign Exchange | Possible impact on earnings or capital arising from movements in exchange rates arising out of maturity mismatches in foreign currency positions other than those denominated in base currency, Sri Lankan Rupee (LKR.) |
Risk tolerance limits for individual currency exposures as well as aggregate exposures within regulatory limits for NOP | High | Medium | Medium | |||||||
| Equity | Possible loss arising from changes in prices and volatilities of individual equities | Mark-to-Market calculations are carried out daily and quarterly for Held-for-Trading (HFT) and Available-for-Sale (AFS) portfolios respectively | Low | Low | Negligible | |||||||
| Commodity | Exposures to changes in prices and volatilities of individual commodities | Mark-to-Market calculations | Low | Low | Negligible |
Table 32
Management of Market Risk
The Market Risk Management Framework of the Bank sets out guidance for management of market risk within the Bank’s overall risk. Key elements include:
- A Robust Risk Governance Structure – Market risk is monitored by the Board, BIRMC and EIRMC which are responsible for formulating policy including setting the parameters of the RAS. ALCO is the principal Management Committee responsible for monitoring market risk exposure and initiating appropriate action to optimise overall market risk exposures within the defined risk appetite. Market Risk Management Unit (MRMU) of the IRMD is responsible for daily Market Risk Management activities including measuring, monitoring and reporting of market risk exposures and facilitating review of the Bank’s market risk-related policies and exposure limits at least annually. It also provides independent reviews on market risks associated with new investment proposals and products to optimise risk-return trade-off. The Treasury Middle Office (TMO) is an integral part of MRMU and functions independently from both the Treasury Front Office (i.e. trading unit) and Treasury Back Office (i.e. settlement unit). TMO independently monitors, measures and analyses exposures as per the comprehensive limit framework pertaining to Treasury transactions. Further it reports on Management Action Triggers (MATs), which alert of imminent limit breaches and recurring loss events, to initiate preventive measures to mitigate potential losses.
- A Comprehensive Suite of Policies – Policies covering various aspects of market risk which include Market Risk Management Policy, Asset and Liability Management (ALM) Policy, Foreign Exchange (FX) Risk Management Policy, Derivative Policy, Treasury Policy and Stress Testing Policy define exposure limits and procedures for transactions.
- Market Risk Limits – These are regularly reviewed by ALCO and EIRMC which are revised to narrower bands than specified in the RAS if market dynamics indicate elevated risk levels.
- MATs –These are risk thresholds that trigger specific actions to safeguard the market risk exposures of the Bank within the levels specified in the RAS.
- Risk Monitoring – ALCO monitors asset and liability gaps and market trends to determine strategy, pricing of risk and funding requirements while also guiding Treasury on management of IRR. Tools such as gap analysis (income perspective) and duration analysis (value perspective) are used to monitor IRR on an ongoing basis factoring the re-pricing characteristics of all assets and liabilities of the Bank’s Balance Sheet. The Bank assesses IRR exposure based on both the Earnings at Risk (EAR) approach focusing on the impact of interest rate changes on its near-term earnings and the Economic Value of Equity (EVE) approach, focusing on the time value of the Bank’s net cash flows from longer time horizon.
- Risk Assessment – A range of techniques including sensitivity analysis, stress testing, Mark-to-Market and Value-at-Risk (VaR) calculations are used to assess market risk across portfolios.
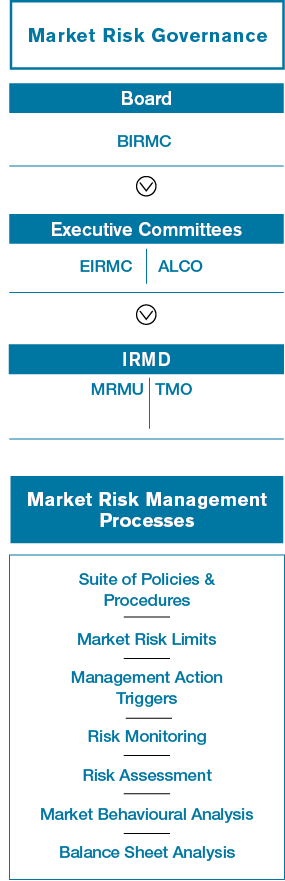
Figure 38
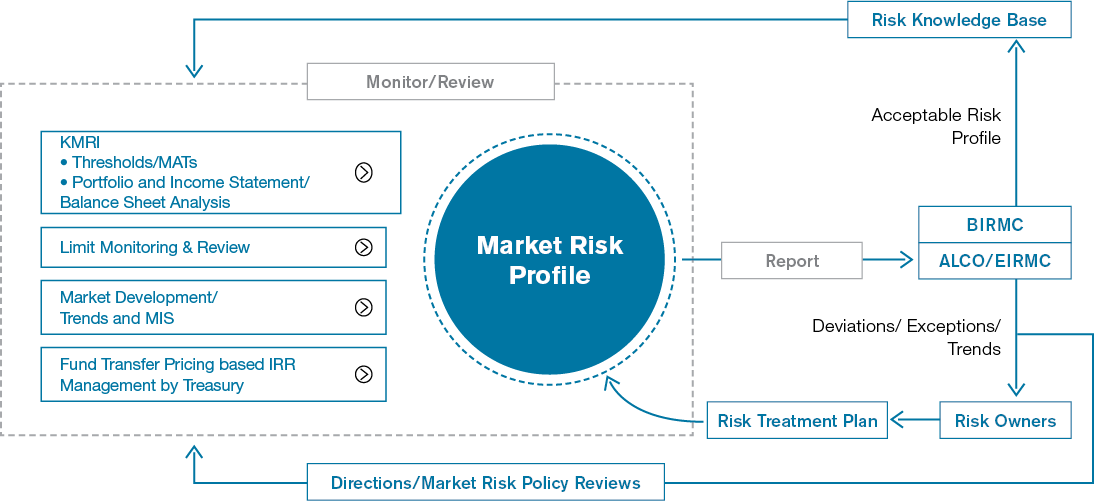
Figure 39
Review of Market Risk
Market risk arises mainly from the
Non-Trading Portfolio (Banking Book) which accounts for 90.82% of the total assets and 93.48% of the total liabilities subject to market risk. Exposure to market risk arises mainly from IRR and FX risk as the Bank has negligible exposure to commodity related price risk and equity and debt price risk which was less than 13% of the total risk weighted exposure for market risk.
The Bank’s exposure to market risk analysed by Trading Book and Non-Trading Portfolios (or Banking Book) are set out in the Table 33 below:
Audited (Rs. Mn.)| as at December 31, 2016 | Market Risk Measurement | |||||
| Carrying Amount | Trading Portfolio | Non-Trading Portfolio | ||||
| Assets Subject to Market Risk | ||||||
| Cash and cash equivalents | 14,704.72 | 0.00 | 14,704.72 | |||
| Balances with Central Banks | 3,403.22 | 0.00 | 3,403.22 | |||
| Placements with banks | 11,718.50 | 0.00 | 11,718.50 | |||
| Securities purchased under resale agreements | 0.00 | 0.00 | 0.00 | |||
| Derivative financial assets | 1,052.83 | 1,052.83 | 0.00 | |||
| Other financial instruments – Held-for-trading | 4,987.80 | 4,987.80 | 0.00 | |||
| Loans and receivables to banks | 624.46 | 0.00 | 624.46 | |||
| Loans and receivables to other customers | 616,018.23 | 0.00 | 616,018.23 | |||
| Financial investments – Available-for-sale | 160,023.47 | 0.00 | 160,023.47 | |||
| Financial investments – Held-to-maturity | 60,981.30 | 0.00 | 60,981.30 | |||
| Financial investments – Loans and receivables | 51,824.03 | 0.00 | 51,824.03 | |||
| 925,338.55 | 6,040.63 | 919,297.92 | ||||
| Liabilities Subject to Market Risk | ||||||
| Due to banks | 67,608.81 | 0.00 | 67,608.81 | |||
| Derivative financial liabilities | 1,515.04 | 1,515.04 | 0.00 | |||
| Securities sold under repurchase agreements | 69,867.47 | 0.00 | 69,867.47 | |||
| Due to other customers/Deposits from customers | 701,410.85 | 0.00 | 701,410.85 | |||
| Other borrowings | 9,270.15 | 0.00 | 9,270.15 | |||
| Subordinated liabilities | 24,849.54 | 0.00 | 24,849.54 | |||
| 874,521.86 | 1,515.04 | 873,006.82 | ||||
Table 33
Market Risk Portfolio Analysis
The gap report is prepared by stratifying Rate Sensitive Assets (RSA), Rate Sensitive Liabilities (RSL), and Off-Balance Sheet items into various time bands according to maturity (if fixed rates) or time remaining to their next re-pricing (if floating rate). Vulnerability of the Bank to interest rate volatility is indicated by the gap between RSA and RSL.
Interest Rate Sensitivity Gap Analysis of Assets and Liabilities of the Banking Book as at December 31, 2016 – Bank.
| Up to 1 Month Rs. Mn. | 1-3 Months Rs. Mn. | 3-6 Months Rs. Mn. | 6-9 Months Rs. Mn. | 9-12 Months Rs. Mn. | 1-3 Years Rs. Mn. | 3-5 Years Rs. Mn. | Over 5 Years Rs. Mn. | Non- Sensitive Rs. Mn. | Total Rs. Mn. | |||||||||||
| Cash on hand | – | – | – | – | – | – | – | – | 17,407 | 17,407 | ||||||||||
| Deposits with Central Banks |
499 | – | – | – | – | – | – | – | 43,374 | 43,873 | ||||||||||
| Balances due from head office, affiliates and own branches | – | – | – | – | – | – | – | – | – | – | ||||||||||
| Balances due from other banks | 19,288 | – | – | – | – | – | – | – | 5,795 | 25,083 | ||||||||||
| Investments | 47,821 | 2,762 | 27,204 | 21,124 | 1,071 | 118,767 | 35,457 | 32,609 | 2,917 | 289,732 | ||||||||||
| Bills of exchange | 12,311 | – | – | – | – | – | – | – | – | 12,311 | ||||||||||
| Overdrafts | 96,016 | – | – | – | – | – | – | – | – | 96,016 | ||||||||||
| Loans and advances | 227,361 | 41,824 | 44,213 | 38,439 | 31,341 | 56,278 | 30,330 | 32,235 | – | 502,021 | ||||||||||
| NPLs | – | – | – | – | – | 374 | 94 | 281 | 2,993 | 3,742 | ||||||||||
| Fixed assets | – | – | – | – | – | – | – | – | 11,022 | 11,022 | ||||||||||
| Net inter-branch transactions | – | – | – | – | – | – | – | – | – | – | ||||||||||
| Accrued interest | – | – | – | – | – | – | – | – | 4,967 | 4,967 | ||||||||||
| Other assets | – | – | – | – | – | – | – | – | 13,071 | 13,071 | ||||||||||
| Reverse Repos | – | – | – | – | – | – | – | – | – | – | ||||||||||
| FRAs | – | – | – | – | – | – | – | – | – | – | ||||||||||
| SWAPs | – | – | – | – | – | – | – | – | – | – | ||||||||||
| Futures | – | – | – | – | – | – | – | – | – | – | ||||||||||
| Options | – | – | – | – | – | – | – | – | – | – | ||||||||||
| Others | – | – | – | – | – | – | – | – | – | – | ||||||||||
| Total Rate Sensitive Assets (RSA) |
403,296 | 44,586 | 71,417 | 59,563 | 32,412 | 175,419 | 65,881 | 65,125 | 101,546 | 1,019,245 | ||||||||||
| Demand deposits | – | – | – | – | – | – | – | – | 57,682 | 57,682 | ||||||||||
| Savings deposits | 4,956 | 179 | 321 | 328 | 311 | 1,868 | 2,243 | 226,614 | – | 236,820 | ||||||||||
| Time deposits | 61,512 | 101,247 | 96,028 | 78,735 | 53,670 | 12,833 | 8,257 | 6 | – | 412,288 | ||||||||||
| Other deposits | 14,666 | – | – | – | – | – | – | – | 4,312 | 18,978 | ||||||||||
| Balances due to head office, affiliates and own branches |
– | – | – | – | – | – | – | – | – | – | ||||||||||
| Balances due to other banks |
– | – | – | – | – | – | – | – | 4,085 | 4,085 | ||||||||||
| Certificates of deposit | 128 | 4 | 11 | 30 | 50 | 53 | – | – | – | 276 | ||||||||||
| Other borrowings | 14,266 | 20,931 | 12,140 | 9,007 | 140 | 662 | 639 | 1,834 | – | 59,619 | ||||||||||
| Net inter-branch transactions |
– | – | – | – | – | – | – | – | – | – | ||||||||||
| Bills payable | – | – | – | – | – | – | – | – | – | – | ||||||||||
| Interest payable | 3,115 | 2,785 | 3,045 | 2,404 | 1,553 | 1,097 | 452 | 66 | – | 14,517 | ||||||||||
| Provisions (Others) | – | – | – | – | – | – | – | – | – | – | ||||||||||
| Capital | – | – | – | – | – | – | – | – | 24,978 | 24,978 | ||||||||||
| Reserves | – | – | – | – | – | – | – | – | 11,371 | 11,371 | ||||||||||
| Retained earnings | – | – | – | – | – | – | – | – | 48,372 | 48,372 | ||||||||||
| Subordinated debt | 11,155 | – | – | – | – | – | 9,502 | 3,678 | – | 24,335 | ||||||||||
| Other liabilities | – | – | – | – | – | – | – | – | 23,350 | 23,350 | ||||||||||
| Repos | 58,450 | 9,450 | 9,620 | 2,252 | 2,791 | 11 | – | – | – | 82,574 | ||||||||||
| FRAs | – | – | – | – | – | – | – | – | – | – | ||||||||||
| Futures | – | – | – | – | – | – | – | – | – | – | ||||||||||
| SWAPs | – | – | – | – | – | – | – | – | – | – | ||||||||||
| Options | – | – | – | – | – | – | – | – | – | – | ||||||||||
| Total Rate Sensitive Liabilities (RSL) |
168,248 | 134,596 | 121,165 | 92,756 | 58,515 | 16,524 | 21,093 | 232,198 | 174,150 | 1,019,245 | ||||||||||
| Period gap | 235,048 | (90,010) | (49,748) | (33,193) | (26,103) | 158,895 | 44,788 | (167,073) | ||||||||||||
| Cumulative gap | 235,048 | 145,038 | 95,290 | 62,097 | 35,994 | 194,889 | 239,677 | 72,603 | ||||||||||||
| RSA/RSL | 2.40 | 0.33 | 0.59 | 0.64 | 0.55 | 10.62 | 3.12 | 0.28 | ||||||||||||
|
Note: Balances are based on SLAS |
||||||||||||||||||||
Table 34
Sensitivity to Projected NII
Regular stress tests are carried out on Interest Rate Risk in Banking Book (IRRBB) encompassing changing positions and new economic variables together with systemic and specific stress scenarios. Change in value of the Fixed Income Securities (FIS) portfolio in HFT category due to abnormal market movements is measured using both EVE and EAR perspectives. Results of stress test on IRR are analysed to identify the impact of such scenarios on Bank profitability and capital.
Impact on NII due to rate shocks on LKR and FCY is continuously monitored to ascertain the Bank’s vulnerability to sudden interest rate movements [Refer Note 69.3.2 (b) on page 348].
| 2016 | 2015 | |||||||
| 100 bp Parallel Up Rs. ’000 | 100 bp Parallel Down Rs. ’000 | 100 bp Parallel Up Rs. ’000 | 100 bp Parallel Down Rs. ’000 | |||||
| As at December 31 | 670,859 | (668,620) | 363,173 | (362,303) | ||||
| Average for the Year | 634,306 | (632,375) | 336,601 | (335,541) | ||||
| Maximum for the Year | 827,488 | (824,962) | 469,161 | (468,336) | ||||
| Minimum for the Year | 366,432 | (365,569) | 267,117 | (266,063) | ||||
Table 35
Foreign Exchange Risk
Stringent risk tolerance limits for individual currency exposures as well as aggregate exposures within the regulatory limits ensure that potential losses arising out of fluctuations in FX rates are minimised and maintained within the Bank’s risk appetite.
USD/LKR exchange rate fluctuated between a low of Rs. 143.72 and a high of Rs. 149.85 (source: Bloomberg) during the year under review and the annual Rupee depreciation was recorded at approximately 4.04%. The Table 36 below indicates the Bank’s exposure to FX risk as at end 2016.
| Net Open Position (NOP) | Overall Exposure in Respective Foreign Currency | Overall Exposure in Rs. | ||||
| ’000 | ’000 | ’000 | ||||
| United States Dollar | 3,179 | 4,709 | 705,226 | |||
| Great Britain Pound | 45 | 3 | 467 | |||
| Euro | 66 | 17 | 2,703 | |||
| Japanese Yen | (150) | 38 | 49 | |||
| Indian Rupee | – | – | – | |||
| Australian Dollar | (40) | (30) | (3,284) | |||
| Canadian Dollars | (1) | 23 | 2,538 | |||
| Other Currencies in US $ | 95 | 160 | 23,948 | |||
| Total Exposure US $ | 3,367 | 4,886 | 731,647 | |||
| Total Capital Funds as at December 31, 2016 |
103,373,535 | |||||
| Total Exposure as a % of Capital Funds as at December 31, 2016 |
0.71% |
Table 36 (CBSL Disclosure)
Stress testing is conducted on NOP by applying rate shocks ranging from 6% to 15% in order to estimate the impact on profitability and capital adequacy of the Bank (Refer Note 69.3.3). The impact of a 1% change in exchange rate on the NOP indicates a loss of
Rs. 147.53 Mn. on the positions as at December 31, 2016.
Equity Price Risk
Although the Bank’s exposure to equity price risk is negligible, Mark-to-Market calculations are conducted daily on HFT and AFS portfolios. The Bank has also commenced VaR calculations on equity portfolio. The Table 37 below summarises the impact of a shock of 10% on equity price on profit, Other Comprehensive Income (OCI) and equity.
Audited| HFT | AFS | Total | ||||
| Impact on Income Statement Rs '000 | Impact on OCI Rs '000 | Impact on Equity Rs '000 | ||||
| Shock of 10% on equity price | 29,381 | 24,655 | 54,036 |
Table 37
Commodity Risk
The Bank has negligible exposure to commodity risk which is limited to the extent of the Pawning portfolio which is subject to fluctuations in the price of gold which amounts to less than 0.12% of total market risk exposure.
Liquidity Risk
Liquidity Risk is the Bank’s inability to meet ‘On’ or ‘Off’ Balance Sheet contractual and contingent financial obligations as they fall due, without incurring unacceptable losses.
Banks are vulnerable to liquidity and solvency problems resulting from asset and liability mismatches. Consequently, the primary objective of liquidity risk management is to assess and ensure availability of funds required to meet obligations at appropriate times, both under normal and stressed conditions.
The Bank has maintained the following Liquid Asset Ratios as at December 31, 2016
| Domestic Banking Unit (DBU) % | Off-shore Banking Unit (OBC) % | |||
| Statutory Liquid Assets Ratio (SLAR) | 27.19 | 30.19 | ||
| Local Currency % | All Currencies % | |||
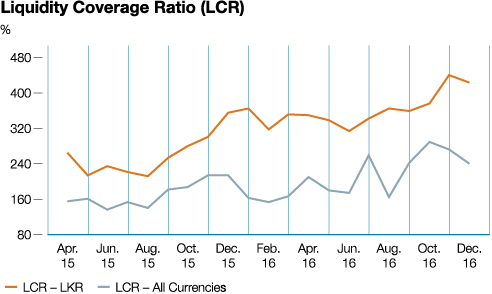
| Liquidity Coverage Ratio (LCR) | 422.96 | 241.35 |
Table 38
Managing Liquidity Risk
The Bank monitors liquidity risk on a continuous basis to ensure that it is managed within the parameters of the risk appetite. Structures and processes in place for management of liquidity risk are described below.
- Governance Structure – ALCO is mandated with the implementation of liquidity risk management policies and procedures which encompass establishing and monitoring liquidity targets, determining strategies and tactics to meet those targets and ensuring availability of sufficient liquidity for unanticipated contingencies. Strategies include effective diversification in sources and tenors of funding, monitoring Off-Balance Sheet activity related liquidity impact and diversifying deposit maturity base avoiding concentration of resources. The Board, BIRMC, ALCO and EIRMC regularly review reports of key liquidity risk indicators to ensure that they are within the agreed parameters.
- Measurement – Liquidity is monitored within both stock (based on key ratios) and flow (based on cash inflows and outflows in time bands) approaches. Key liquidity risk indicators used by the Bank to assess adequacy of its liquidity position include Statutory Liquid Asset Ratio (SLAR), Liquidity Coverage Ratio (LCR), Net Advances to Deposit Ratio, Dynamic and Static (Structural) Liquidity Gap Summary, Core Funding Ratio, Funding Concentration and Commitments Vs Funding Sources. A more stringent internal limit is in place for maintaining SLAR as compared to the statutory requirement of 20% of total liabilities excluding contingent liabilities as well as LCR as per the Basel III Guidelines.
Graph 84
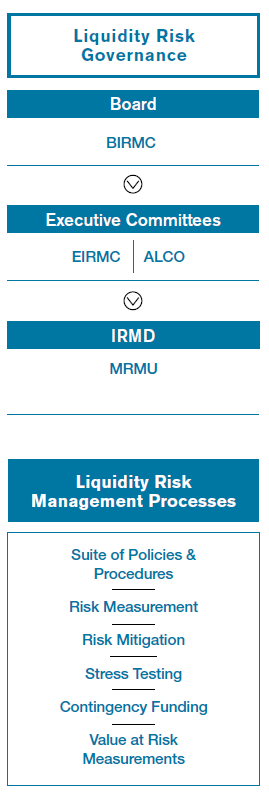
Figure 40
- Risk Mitigation – An adequate margin is maintained in high quality liquid assets and access to diverse funding sources such as inter-bank market, wholesale and retail repurchase agreements, assets and investments available-for-sale. Additionally, contingency funding agreements with peer banks are in place ensuring availability of adequate liquidity to fund its existing asset base and growth whilst maintaining sufficient liquidity buffers to operate smoothly under varying market conditions including any short-term, medium or long-term market disruptions.
- Stress Testing – Regular liquidity stress tests and scenario analysis are done to evaluate the potential impact of sudden and severe stress events on the Bank’s liquidity position. This enables the Bank to proactively identify appropriate funding arrangements that can be used to manage such stress situations with a minimum financial and/or reputational impact.
- Contingency Funding – The Contingency Funding Plan provides guidance in managing liquidity in Bank specific or market specific scenarios. It outlines how assets and liabilities of the Bank are to be monitored, emphasising avoidance of a liquidity crisis. These procedures address unlikely but possible events of either short or long-term funding crisis, forecast funding needs as well as funding sources under different market situations including aggressive asset growth or loan rollover and rapid liability erosion or sharp decline in deposits during a 3-month period which is considered the most critical time span in a liquidity crisis. The management and reporting framework identifies early warning signals and enumerates means to avoid and mitigate possible crises promptly. A Management Action Plan with alternative sources of inflows and trigger levels for action, a communication plan to prevent further escalation or contagion and regular sources of liquidity supplemented with contingent sources in detail are among other things covered under this critical document.
- Value at Risk (VaR) – The Bank carries out VaR calculations on four portfolios categorised as HFT, using a market risk software solution with the capability of computing VaR in three methodologies namely, Historical Simulation, Monte Carlo Simulation and Variance-Covariance in order to measure its market risk exposure. VaR is computed in line with Basel II Market Risk Framework, considering a 99% ‘Confidence Interval’ and a 10-trading-days Holding Period. VaR, a quantitative measure depicts the maximum loss the Bank may incur, under specific conditions during a given period due to changes in interest rates, exchange rates, debt and equity prices as well as price of financial products.
The Bank is in the process of obtaining validation on VaR model through an external consultant. Recommendations that are forthcoming are to deployed for effective decision making.
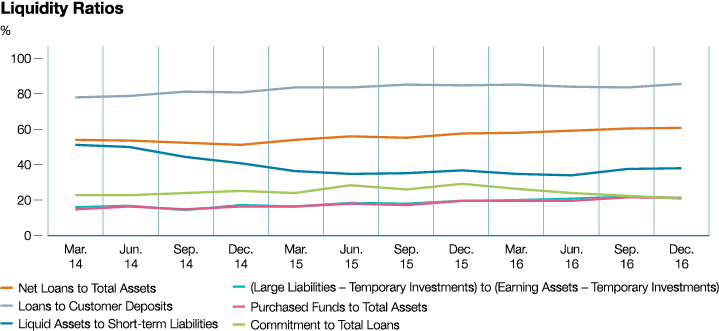
Liquidity Risk Review
The Net Loans to Deposits Ratio is regularly monitored by ALCO to ensure that the asset and liability portfolios of the Bank are geared to maintain a healthy liquidity position. Loans to steady funding sources (Core Funding Ratio) indicating stability of funding sources compared to loans and advances granted was maintained well above the policy threshold of 90%, which is considered healthy to support the Bank’s business model and growth.
The key ratios used for measuring liquidity under the Stock approach are depicted graphically below: (Graph 85)
Graph 85
241.35% Liquidity Coverage Ratio (LCR) Liquidity Coverage Ratio of the Bank which stood at 241.35% was well above the statutory requirement of 100%
Maturity Gap Analysis of Assets and Liabilities as at December 31, 2016 – Bank
Maturity analysis of Assets and Liabilities of financial assets and financial liabilities of the Bank (Table 39) indicates sufficient
funding for foreseeable adverse situations based on prescribed behavioural patterns of depositors.
| Up to 1 Month Rs. Mn. | 1-3 Months Rs. Mn. | 3-6 Months Rs. Mn. | 6-9 Months Rs. Mn. | 9-12 Months Rs. Mn. | 1-3 Years Rs. Mn. | 3-5 Years Rs. Mn. | Over 5 Years Rs. Mn. | Total Rs. Mn. | ||||||||||
| Cash and cash equivalents | 17,407 | – | – | – | – | – | – | – | 17,407 | |||||||||
| Deposits with Central Banks | 6,656 | 5,738 | 5,450 | 4,026 | 3,149 | 3,792 | 3,746 | 11,316 | 43,873 | |||||||||
| Balances due from head office, affiliates and own branches |
– | – | – | – | – | – | – | – | – | |||||||||
| Balances due from other banks | 23,448 | 1,635 | – | – | – | – | – | – | 25,083 | |||||||||
| Investments | 8,125 | 12,070 | 40,982 | 25,647 | 1,101 | 127,982 | 38,470 | 35,355 | 289,732 | |||||||||
| Bills of exchange | 12,311 | – | – | – | – | – | – | – | 12,311 | |||||||||
| Overdrafts (ODs) | 7,201 | 7,201 | 7,201 | 7,201 | 7,201 | 20,003 | 20,003 | 20,005 | 96,016 | |||||||||
| Loans and advances | 45,941 | 66,543 | 51,569 | 31,070 | 20,579 | 126,058 | 69,358 | 90,903 | 502,021 | |||||||||
| NPLs | – | – | – | – | 935 | – | – | 2,807 | 3,742 | |||||||||
| Net inter-branch transactions | – | – | – | – | – | – | – | – | – | |||||||||
| Other assets | 16,720 | 258 | 433 | 50 | 51 | 215 | 109 | 11,224 | 29,060 | |||||||||
| Lines of credit committed from institutions | 1,000 | – | – | – | – | – | – | – | 1,000 | |||||||||
| Others (Reverse Repos) | – | – | – | – | – | – | – | – | – | |||||||||
| Total | 138,809 | 93,445 | 105,635 | 67,994 | 33,016 | 278,050 | 131,686 | 171,610 | 1,020,245 | |||||||||
| Demand Deposits | 12,721 | 12,721 | 9,541 | 6,361 | 6,361 | – | – | 15,902 | 63,607 | |||||||||
| Savings Deposits | 12,493 | 12,494 | 12,493 | 12,493 | 12,493 | 62,468 | 62,468 | 62,468 | 249,870 | |||||||||
| Balances due to head office, affiliates and own branches |
– | – | – | – | – | – | – | – | – | |||||||||
| Balances due to other banks | 16,854 | 17,103 | 12,461 | 9,466 | 481 | 1,922 | – | – | 58,287 | |||||||||
| Time Deposits | 49,846 | 80,450 | 74,416 | 64,116 | 42,305 | 9,487 | 5,967 | 85,701 | 412,288 | |||||||||
| Certificates of Deposit, Borrowings and Bonds | 208 | 93 | 215 | 117 | 234 | 987 | 10,250 | 17,925 | 30,029 | |||||||||
| Net Inter-Branch Transactions | – | – | – | – | – | – | – | – | – | |||||||||
| Bills payable | – | – | – | – | – | – | – | – | – | |||||||||
| Interest payable | 2,962 | 2,695 | 2,911 | 2,325 | 1,553 | 1,079 | 446 | 66 | 14,037 | |||||||||
| Provisions other than NPLs & Depreciation of Investments |
– | – | – | – | – | – | – | – | – | |||||||||
| Other Liabilities | 18,470 | 1,077 | 1,077 | 1,033 | – | – | 2,174 | – | 23,831 | |||||||||
| Lines of Credit committed to institutions |
1,000 | – | – | – | – | – | – | – | 1,000 | |||||||||
| Unutilised portion of ODs & Advances |
95,923 | – | – | – | – | – | – | – | 95,923 | |||||||||
| Letters of Credit/Guarantees/ Acceptance |
31,677 | 36,438 | 17,105 | 9,281 | 10,242 | 12,043 | 1,138 | – | 117,924 | |||||||||
| Repos/Bills Rediscounted/ Swaps/Forward Contracts |
161,222 | 85,183 | 45,650 | 25,333 | 17,891 | 10,123 | – | – | 345,402 | |||||||||
| Others | – | – | – | – | – | – | – | – | – | |||||||||
| Total | 403,376 | 248,254 | 175,869 | 130,525 | 91,560 | 98,109 | 82,443 | 182,062 | 1,412,198 | |||||||||
| Period Gap | (264,568) | (154,809) | (70,234) | (62,531) | (58,544) | 179,941 | 49,243 | (10,452) | ||||||||||
| Cumulative Gap | (264,568) | (419,376) | (489,611) | (552,142) | (610,686) | (430,745) | (381,502) | (391,954) | ||||||||||
| Cumulative liabilities | 403,376 | 651,630 | 827,499 | 958,024 | 1,049,584 | 1,147,693 | 1,230,137 | 1,412,199 | ||||||||||
| Cumulative gap as a percentage (%) of cumulative liabilities |
-66% | -64% | -59% | -58% | -58% | -38% | -31% | -28% |
Note: Balances are based on SLAS
Table 39 (CBSL Disclosure)
Maturity analysis of financial assets and financial liabilities of the Bank (Table 39) does not indicate any adverse situation when due cognisance is given to the fact that cash outflows include savings deposits which can be considered as a quasi stable source of funds based on historical behavioural patterns of such depositors.
The liquidity position is measured in all major currencies at both individual and aggregate levels to ensure that potential risks are within specified threshold limits. Additionally, potential liquidity commitments resulting from loan disbursements and undrawn overdrafts are also monitored to ensure sufficient funding sources.
Funding Diversification by Product
The Bank’s primary sources of funding are deposits from customers. The Graph 86 provides a product-wise analysis of the Bank’s funding diversification as at year end.
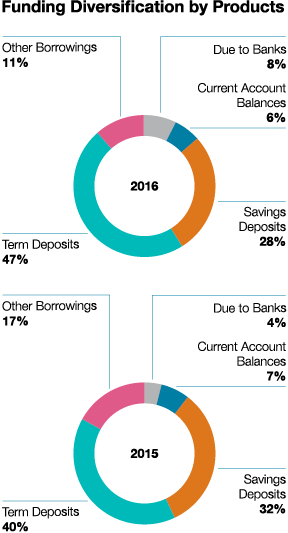
Graph 86
Credit Ratings
The Bank’s ability to borrow is significantly dependent on its credit ratings which were as follows:
| Operations/Entity | Rating Agency | Rating | ||
| Commercial Bank of Ceylon PLC | Fitch Ratings Lanka Ltd. | AA (lka)/ Stable | ||
| Bangladesh | Credit Rating Information and Services Ltd. (CRISL) |
AAA |
Table 40
The rating of AA (lka) is the strongest rating given to a Sri Lankan non-state sector bank. The AAA (Triple A) long-term credit rating accorded to the Bangladesh operations of Commercial Bank PLC has been reaffirmed by CRISL for the sixth consecutive year and is the highest credit rating given to any financial institution in Bangladesh by CRISL. (Table 40)
Operational Risk
Operational Risk is the risk of losses stemming from inadequate or failed internal processes, people and systems, or from external events such as natural disasters, social or political events. It is inherent in all banking products and processes and our objective is to control it in a cost-effective manner. Operational risk includes Legal Risk but excludes Strategic and Reputational Risk.
Managing Operational Risk
The Bank manages operational risk based on an organisation-wide consistent framework that enables determination of its operational risk profile in comparison to its risk appetite and systematically identifies operational risk themes and concentrations to define risk mitigating measures and priorities. These are described below.
- Governance – The Board of Directors aided by the BIRMC ensures that a sufficiently robust framework for managing operational risks is established. The Bank’s first line of defence is the Management and staff of the Bank and a rigorous system of review is in place to identify operational risks within the strategic business units. An independent Operational Risk Management Unit (ORMU) reporting to the Chief Risk Officer (CRO) supports the EIRMC in monitoring operational risk providing independent oversight of the first line of defence. Internal Audit provides assurance on the effectiveness and integrity of the first and second lines of defence independently to the BAC.
- Policies – The Bank’s Operational Risk Management Framework defines the Bank’s approach in identifying, assessing, mitigating, monitoring and reporting the operational risks which may impact the achievement of the Bank’s business objectives. The risk management responsibilities and obligations of the Board of Directors, Corporate Management, ORMU and all other Risk Owners are clearly specified in the Operational Risk Management Policy which is reviewed annually.
- Risk Assessment – Each business function proactively identifies and assesses its significant operational risks and the controls in place to manage those risks in a semi-annual RCSA process which is automated via the Operational Risk Management System (ORMS). Findings from the RCSA exercise is used to formulate appropriate action plans to address identified control gaps which are monitored as part of the overall Operational Risk Management exercise. The Bank also conducts reviews of new products, processes, services, operations, etc., to assess risk on a regular basis.
- Risk Mitigation – Risk mitigation is planned in accordance with the ‘as low as reasonably practicable’ principle by balancing the cost of mitigation with the benefits thereof and formally accepting the Residual Risk. Several risk mitigation policies and programmes, including a robust internal control framework are in place to maintain a sound operating environment within the established risk appetite of the Bank.
• Insurance coverage is used as an external mitigant for ‘low probability – high impact’ events and uncontrollable operational risk events such as damage to physical assets by natural disasters, fire etc. Insurable risks are transferred to reputed insurance providers, which are periodically reviewed comprehensively by the ORMU for adequacy.
• Policies and procedures relating to outsourcing of business activities of the Bank ensure that all significant risks arising from outsourcing arrangements of the Bank are identified and effectively managed on a continuous basis. Details of all outsourced functions are reported to CBSL annually. Due diligence tests of outsourced vendors are carried out by respective Risk Owners prior to executing new agreements and renewal of existing agreements. Assistance of Information Systems Audit Unit is obtained when conducting due diligence tests
of outsourced parties which provide
IT services.
• Technology risk is managed in a systematic and consistent manner to avoid potential operational losses to the Bank resulting from technological obsolescence. Accordingly, existing Information Technology systems including the core-banking systems are upgraded and new software solutions implemented in a timely and appropriate manner.
• The Bank has a comprehensive Business Continuity Plan (BCP) and Disaster Recovery Plan (DRP) to assure the immediate continuity of all essential operations in case of a disaster and the eventual continuity of all other operations, which are continuously updated and tested to ensure ongoing readiness. These plans are reviewed independently by ORMU and Internal Audit Department in line with CBSL requirements.
• Creating a culture of risk awareness across the Bank through comprehensive training programmes together with high standards of ethics and integrity is also a key component of the Bank’s risk mitigatory measures.
- Monitoring and Reporting of Operational Risk – Key Operational Risk Indicators (KORIs) and corresponding tolerance levels are reported to designated Committees and the Board. KORIs comprise of both financial and non-financial indicators. A database of operational risk events and losses, including losses without any financial impact and ‘near-misses’ has been established through the ORMS to facilitate the analysis of loss trends and root causes as prescribed in Basel II. This is a key component in progressing towards advanced approaches in operational risk capital calculations in future.
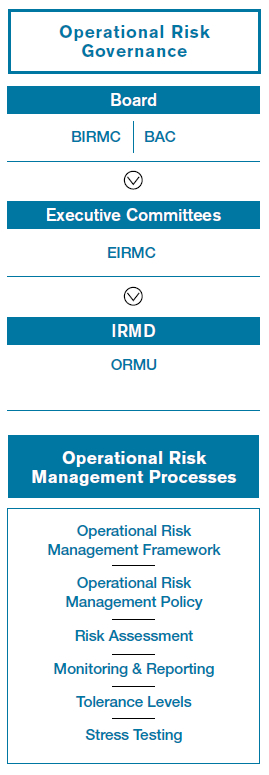
Figure 41
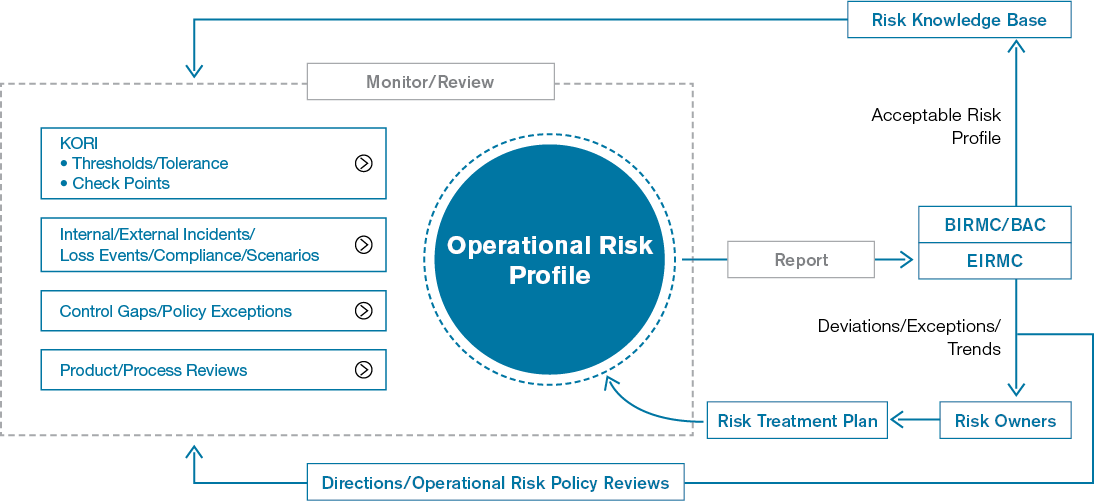
Figure 42
- Stress Testing of Operational Risk –
The Bank commenced conducting of stress testing on operational losses during the year 2014 by considering the historical data as per the scenarios proposed in the Stress Testing Policy
of the Bank. This exercise is being carried out quarterly by the Bank as
an additional measure to confirm its sound position.
Review of Operational Risk
The Bank has a low appetite for operational risks and has established tolerance levels for all material operational risk loss types by considering several factors which include historical loss data, budgets and forecasts, performance of the Bank, existing systems and controls governing Bank operations, etc. Thresholds established for monitoring purposes considering audited financials are:
- Alert Level – 3% of the average gross income for the last three years
- Maximum Level – 5% of the average gross income for the last three years
Operational losses for the financial year 2016 were below the internal Alert Level at 0.44% (of average audited gross income for last three years) reflecting the ‘tone at the top’, effectiveness of the governance structures and the rigour of processes and procedures in place to manage operational risk. The trend line also demonstrates the Bank’s consistency in maintaining losses at minimal levels over the period of the last seven years (Graph 87).
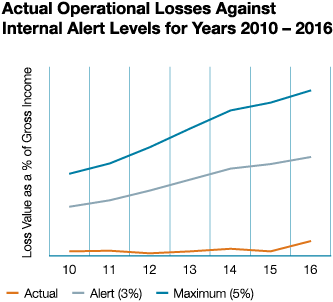
Graph 87
The Graph 88 analyses the operational
risk losses incurred by the Bank under each business line/category during the
year 2016.
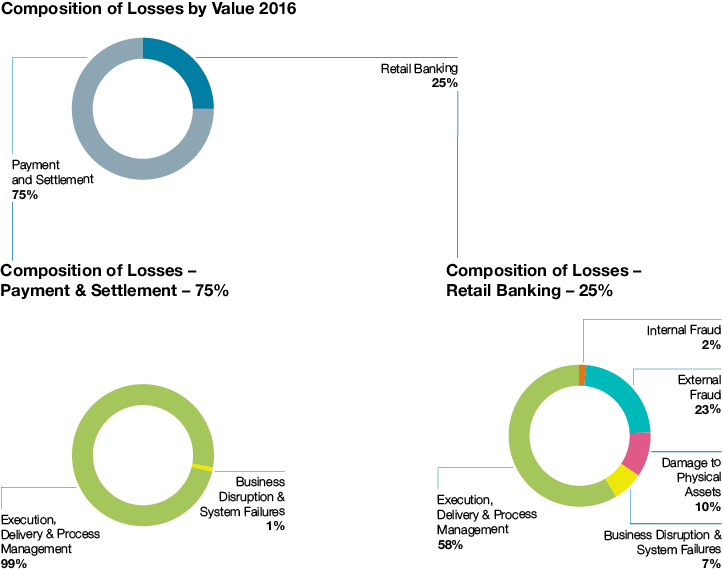
Graph 88
When analysing the losses incurred during 2016 under the Basel II defined business lines, it is evident that the majority (75%) of losses with financial impact falls under the business line of ‘Payment and Settlement’, followed by the losses reported under the ‘Retail Banking’ business line. The Bank managed to resolve two incidents that had contributed to 88% of the Payment and Settlement-related losses through subsequent recovery/rectification. Further, necessary process improvements have been introduced to prevent recurrence. Losses relating to other business lines remain negligible.
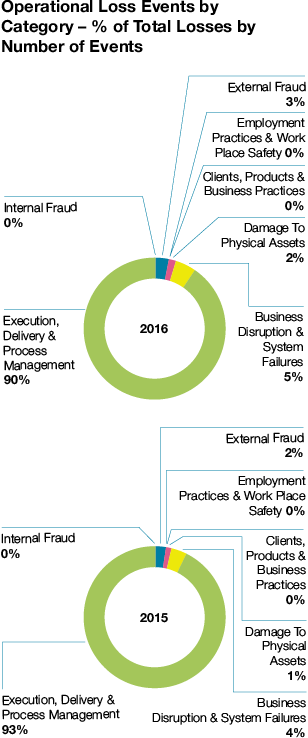
The Graphs 89 and 90 on page 400 depict the comparison of operational losses reported during the last two years (2016 and 2015) under each Basel II loss event type both in terms of number of occurrences and value.
Graph 89
As typical with operational risk losses, majority of the losses encountered by the Bank during 2016 consists of high frequency/low financial impact events mainly falling under the loss category ‘Execution, Delivery and Process Management’. These low value events are mainly related to cash and ATM operations of the Bank’s service delivery network consisting of over 900 points across
Sri Lanka and Bangladesh. Individual events with monetary values less than
Rs. 100,000 account for more than 96%
of the total loss events for the year. Also, the number of loss events for the year when compared to the number of transactions performed during the year stands at a mere 0.008%.
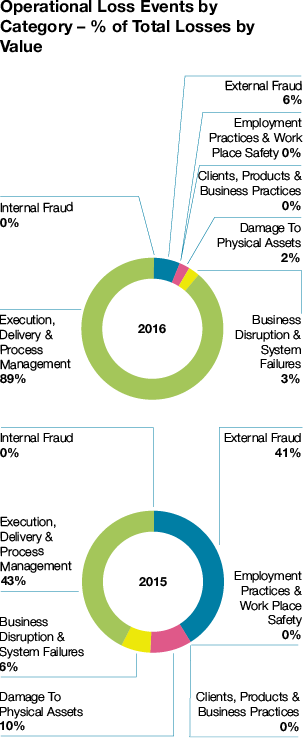
Graph 90
When considering the values of the losses incurred by the Bank during the period under review (2016), they can be mainly categorised under Execution, Delivery and Process Management related, External Fraud, Business Disruption and System Failures and Damage to Physical Assets. Nevertheless, as described earlier, total of the actual operational risk related losses for 2016 remains at a mere 0.44% of the average audited gross income for last three years, as compared to the capital allocation of 15% under the Basic Indicator Approach of capital computation as per Basel II. This trend of exceptionally low levels of operational risk losses of the Bank bears testimony to the effectiveness of the Bank’s Operational Risk Management Framework and the internal control environment.
IT Risk
Defined as the business risk associated with use, ownership, operation, involvement, influence and adoption of IT within an organisation, IT Risk is a key area of concern globally as threats continue to escalate in magnitude and audacity.
A major component of operational risk,
IT risk comprises IT-related events such as system interruptions, errors, frauds through system manipulations, cyber attacks, obsolescence in applications, falling behind competitors concerning the technology, etc., that could potentially impact the business as a whole. Occurrence is uncertain with regard to frequency and magnitude, posing challenges in managing this vital aspect.
A dedicated, independent IT Risk Function under the ORMU is responsible for implementation of the IT Risk Management Framework for the Bank, facilitating management of all significant IT risks in a consistent and effective manner across the organisation. The IT Risk Management Policy, aligned with the Operational Risk Management Policy of the Bank complements the Information Security Policy, the related processes, objectives and procedures relevant for managing
risk and improving information security
of the Bank.
Year 2016 saw the number of cyber attacks directed at global financial institutions of all sizes growing, including several high profile attacks involving fraudulent fund transfers, data breaches, ransom demands and other hacks. As a key player in the local financial sector, Commercial Bank too realises that it is a likely target for cyber attacks akin to any other organisation. In light of this growing sophistication and variety of cyber attacks and the scale of their impact, the Bank has made reinforcement for this emerging IT risk category a top management priority, with the IT Risk Function giving more focus to cyber security strategies.
With regard to the overall IT Risk Management process, RCSA is used as one of the core mechanisms for IT risk identification and assessment, while the IT Risk Unit carries out independent IT risk reviews both separately and in conjunction with regular operational risk reviews, in line with the established structure of the Operational Risk Management process. Results of these independent IT risk assessments together with audit findings, analysis of information security incidents, internal and external loss data are also employed for IT risk identification and assessment purposes.
IT risk mitigation involves prioritising, evaluating and implementing the appropriate risk-reducing controls or risk treatment techniques recommended from the risk identification and assessment process. The Bank seeks to operate within a highly secure environment which protects its data, systems, people and other information assets from various threats, through robust technology solutions, security policies and processes. A range of controls including technical, operational and management controls required to mitigate its identified IT risks and potential vulnerabilities have been implemented, strengthened by the Bank’s implementation of an Information Security Management System (ISMS) established as per ISO/IEC 27001:2013 information security standard.
We have continued to invest in information security, embarking upon a roadmap
to improve our resilience towards the
cyber threats:
- A key initiative during the year was streamlining the cyber incident management process by realigning responsibilities for cyber incident response via the Network Operations Centre;
- The cyber incident response capabilities were further expanded by improving the security incident and event monitoring function, which is a stepping stone towards establishing a fully-fledged Security Operations Centre to detect and respond to increasingly sophisticated cyber attacks;
- The existing processes for regular vulnerability assessment, penetration testing, code reviews and other special security assessments were enhanced by expanding the scope and depth with particular focus on external facing interfaces of the Bank, which are most susceptible for cyber attacks;
- As part of on-going procedural improvements, the System Development Life Cycle, IT functional processes and third party agreements were reviewed from an information security perspective to make necessary enhancements to embed security end-to-end in key processes.
Given that risk management relies heavily on an effective monitoring mechanism, the IT Risk Function carries out continuous, independent monitoring of the Bank’s IT risk profile. A range of tools and techniques including Key IT Risk Indicators (KIRIs) are used in this activity, where deviations from set thresholds receive a differential level of management attention in order to initiate appropriate corrective action.
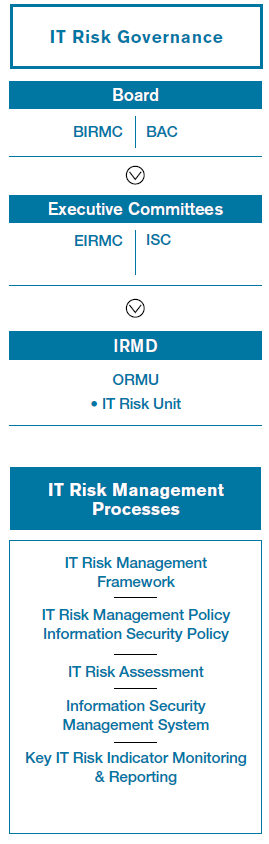
Figure 43
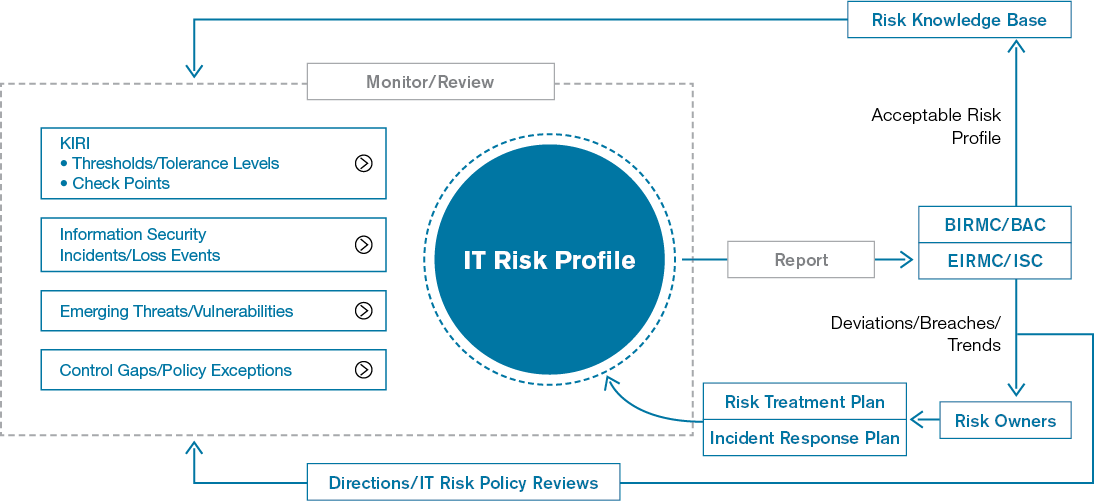
Figure 44
Legal Risk
Defined as the exposure to the adverse consequences resulting from inaccurately drafted contracts, their execution, the absence of written agreements or inadequate agreements, Legal Risk is an integral part of operational risk. It includes, but is not limited to, exposure to fines, penalties, or punitive damages resulting from supervisory actions, as well as cost
of private settlements.
Legal risk is managed by ensuring that applicable regulations are fully taken into consideration in all relations and contracts with individuals and institutions who maintain business relationships with the Bank, and that they are supported by required documentation whereas risk of breaching the rules and regulations are managed by establishing and operating a sufficient mechanism for verification of conformity of operations with applicable regulations.
Compliance and Regulatory Risk
Compliance and Regulatory Risk refers to the potential risk of incurring regulatory sanctions, financial and/or reputational damage arising from failure to comply with applicable laws, rules and regulations and codes of conduct applicable to banking activities. A Compliance Function reporting directly to Board of Directors is in place to assess the Bank’s compliance with external and internal regulations. A comprehensive Compliance Policy specifies how this key risk is identified, monitored and managed by the Bank in a structured manner.
Other Related Risks
Strategic Risk
Strategic Risks are those that either affect or are created by strategic decisions. They could materialise due to internal or external factors and can cause reduction in shareholder value, loss of earnings, etc. Strategic goals are determined through the corporate planning and budgeting process, and critical evaluation of their alignment with the Bank’s vision, mission and the risk appetite, facilitates management of strategic risk. The detailed scorecard-based qualitative model aligned to ICAAP is used to measure and monitor strategic risk of the Bank. This scorecard-based approach takes into consideration a range of factors, including the size and sophistication of the organisation, the nature and complexity of its activities in measuring strategic risk and highlights the areas that need emphasis to mitigate potential strategic risks.
Reputational Risk
Reputational Risk is the risk of adverse impact on earnings or organisational value arising from negative stakeholder perception of the Bank’s business practices, activities and financial condition. The Bank recognises that reputational risk is driven by a wide range of other business risks that must all be actively managed. Accordingly, reputational risk is broadly managed through the systems and controls adopted for all other risk types such as credit, market, operational risk etc., which are underpinned by the code of conduct and business ethics. Further, reputational risk is measured through the detailed scorecard-based model developed by the Bank to measure and monitor reputational risk under ICAAP. Timely actions are initiated to mitigate potential reputational risks by critically evaluating the criteria given in the said scorecard.
Capital Management
The ICAAP Framework in line with Basel requirements sets out the process for assessing total overall capital adequacy in relation to its risk profile. Internal limits which are more stringent than the regulatory requirement provide early warnings with regard to capital adequacy.
| Capital Ratios | Goal (Internal Limit) | 2016 (%) | 2015 (%) | |||
| Tier I (Regulatory minimum 5%) | > 8 | 11.56 | 11.60 | |||
| Total Capital (Regulatory minimum 10%) | > 13.5 | 15.89 | 14.26 |
| Capital | 2016 (Rs. ’000) | 2015 (Rs. ’000) | ||
| Tier I: Core capital | 76,913,661 | 65,767,337 | ||
| Deductions & adjustments | -1,706,794 | -924,886 | ||
| Eligible Tier I capital | 75,206,867 | 64,842,451 | ||
| Tier II: Supplementary capital | 29,232,514 | 15,303,946 | ||
| Deductions & adjustments | -1,065,846 | -458,425 | ||
| Total capital base | 103,373,535 | 79,687,972 | ||
| Risk-weighted assets | 650,509,591 | 558,828,383 |
Table 41
We are compliant with both regulatory and our own prudential requirements. We are also well positioned to meet future expected requirements as we continue to generate sufficient cashflow to support our growth aspirations and business needs.
Capital Management Process
ICAAP supports the regulatory review process providing valuable inputs for evaluating the required capital in line with future business plans. It integrates strategic plans and risk management plans with the capital plan in a meaningful manner with inputs from Senior Management, Management Committees, Board Committees and the Board. It also supports profit optimisation through proactive decisions on exposures both current and potential through measurement of vulnerabilities by carrying out stress testing and scenario-based analysis. The ICAAP process also identifies gaps in managing qualitative and quantitative aspects of reputational risk and strategic risk which are not covered under Pillar 1 of Basel II.
Basel III Minimum Capital Requirements and Buffers
The Banking Act Direction No. 01 of 2016 introduced capital requirements under Basel III for Licensed Commercial Banks commencing from July 01, 2017 with specified timelines to increase minimum capital ratios to be fully implemented by January 01, 2019.
The CAR to be maintained by a bank having more than Rs. 500 Bn. Asset base as at July 01, 2017 vis-a-vis the Bank’s position as at December 31, 2016 is produced below which provides testimony on the ability of the Bank to meet the stringent requirements brought in by the regulator from current perspective.
| Ratios (%) | Bank’s Position as at 31.12.2016 | Minimum Capital Ratio Prescribed by CBSL by 01.07.2017 | Minimum Capital Ratio Prescribed by CBSL by 01.01.2019 | |||
| Common Equity Tier I (CETI) including Capital Conservation Buffer (CCB) and Capital Surcharge on Domestic Systemically Important Banks (D-SIBs) | 10.60 | 6.25 | 8.50 | |||
| Total Tier I including CCB and Capital Surcharge on D-SIBs | 10.60 | 7.75 | 10.00 | |||
| Total Capital including CCB and Capital Surcharge on D-SIBs | 15.20 | 11.75 | 14.00 |
Table 42
However, the Bank acknowledges the challenges associated with increasing demand on capital as per the roadmap given by CBSL and is mindful about all the contributory factors that require in recording a healthy CAR in the ensuing period.
For instance, the Bank does not have access to Tier II capital or alternative Tier I capital instruments that fulfil Basel III definitions. Details of the debentures that were issued prior to Basel III guidelines (effective from July 1, 2017), and considered as qualifying instruments during the transition period are given in the Note 52 to the Financial Statements on page 294.
‘Basel Workgroup’ of the Bank consists of representation from members from a cross-section of business units and supporting units that work as a team to ascertain levels of capital adequacy in line with strategic direction of the Bank. While ICAAP acts as a foundation for such assessment, the Basel Workgroup is constantly on the lookout for improvements amidst changing landscape in different frontiers, to recommend to the ALCO on the desired way forward including indications on current and future capital needs, anticipated capital expenditure based assessments and desirable capital levels, etc. The Bank is aware of the importance of capital as a scarce and valuable resource. The Bank has access to contributions from shareholders as well as to built up capital over a period of time by adopting prudent dividend policies, ploughing back an increased level of retained profits, etc. In addition, the Bank is continuously finding ways to improve judicious use of capital allocation requirements associated with day-to-day activities so that an optimised level of capital allocation can be achieved. The challenges associated with mobilising capital from external sources are also given due cognisance, but not excluded as a sustainable option to boost the capital in the long run. The Bank is reasonably comfortable with the current and future availability of capital buffer to withstand an ambitious growth/ stressed market conditions, but not complacent with current comfort levels and believe in providing stakeholder confidence that the Bank is known for, through sound capital buffer levels.
Stress Testing
An integral part of ICAAP under Pillar 2, stress testing is used to evaluate the sensitivity of the current and forward risk profile relative to risk appetite. It also supports a number of business processes, including strategic planning, the ICAAP including capital management, liquidity management, setting of risk appetite triggers and risk tolerance limits, mitigating risks through actions such as reviewing and changing limits, limiting or reducing exposures and hedging thereof, facilitating the development of risk mitigation or contingency plans across a range of stressed conditions supporting communication with internal and external stakeholders.
The Bank’s Stress Testing Governance Framework sets out the responsibilities for and approaches to stress testing activities which are conducted at Bank, business line and risk type level. The Bank’s stress testing programme uses one or a combination of stress testing techniques, including scenario analysis, sensitivity analysis and reverse stress testing to perform stress testing for different purposes.
The framework covers all the material risks such as credit risk, credit concentration risk, operational risk, liquidity risk, FX risk, IRRBB using EVE and EAR perspectives. The Bank looks at different degrees of stress levels which are defined as Minor, Moderate and Severe stress levels in the Stress Testing Policy. The resultant impact on the capital through these stress tests is carefully analysed. If the stress tests bring about a deterioration of the capital which has no impact on the policy level on capital maintenance, same is defined as Minor Risk, while a deterioration of up to 1% is considered Moderate Risk. If the impact results in the capital falling below the statutory requirement such a level will be considered Severe Risk, warranting immediate attention of the Management to rectify the situation.
As it provides a broader view of all risks borne by the Bank in relation to its risk tolerance and strategy in a hypothetical stress situation, stress testing has become an effective communication tool to Senior Management, Risk Owners and Risk Managers as well as Supervisors and Regulators. The results of the stress testing are reported to the EIRMC and BIRMC on a quarterly basis for appropriate, proactive decision making. Extracts from the stress testing results are set out in the Table 43.
Impact on CAR on Minor, Moderate and Severe Shocks
| 2016 | 2015 | |||||||||||||
| Particulars | Description | Minor % | Moderate % | Severe % | Minor % | Moderate % | Severe % | |||||||
| Credit Risk – Asset Quality Downgrade | Increasing the direct non-performing facilities over the direct performing facilities for the entire portfolio | -0.14 | -0.36 | -0.70 | -0.12 | -0.30 | -0.58 | |||||||
| Operational Risk | 1. Top five operational losses during last five years
2. Average of yearly operational risk losses during last three years |
-0.01 | -0.03 | -0.05 | -0.01 | -0.03 | -0.06 | |||||||
| Foreign Exchange Risk | % shock in the exchange rates for Sri Lanka and Bangladesh operations (gross positions in each book without netting) |
-0.06 | -0.10 | -0.15 | -0.07 | -0.11 | -0.17 | |||||||
| Liquidity Risk (LKR) – Sri Lanka |
1. Withdrawal of % of the clients, banks and other banking institution deposits from the Bank within a period of three months 2. Rollover of loans to a period greater than three months | -0.24 | -0.53 | -0.83 | -0.24 | -0.53 | -0.90 | |||||||
| Interest Rate Risk – EAR and EVE (LKR) – Sri Lanka |
To assess the long-term impact of changes in interest rates on Bank’s EVE through changes in the economic value of its assets and liabilities and to assess the immediate impact of changes in interest rates on Bank’s earnings through changes in its Net Interest Income (Nil) | -1.33 | -2.45 | -3.42 | -1.63 | -2.92 | -3.97 | |||||||
Table 43
Table 44 on pages 405 to 408 sets out Basel II Capital Adequacy Computation disclosures of the Group.
Capital Adequacy Computation – Group (Basel II)
1. Capital Adequacy Ratios
1.1 Core Capital Ratio
| As at December 31, | 2016 (Rs. ’000) | 2015 (Rs. ’000) | ||
| Total eligible core capital (Tier I capital) (Refer Note 2.1) | 76,605,502 | 64,914,870 | ||
| Total risk-weighted assets (Refer Note 3) | 661,045,970 | 561,797,326 | ||
| Total eligible core capital (Tier I capital) (Minimum requirement 5%) (%) | 11.59 | 11.55 |
1.2 Total Capital Ratio
| As at December 31, | 2016 (Rs. ’000) | 2015 (Rs. ’000) | ||
| Total capital base (Refer Note 2.2) | 105,837,614 | 80,218,414 | ||
| Total risk-weighted assets (Refer Note 3) | 661,045,970 | 561,797,326 | ||
| Total capital ratio (Minimum requirement 10%) (%) | 16.01 | 14.28 |
2. Computation of Capital
2.1 Computation of Eligible Core Capital (Eligible Tier I Capital)
| As at December 31, | 2016 (Rs. ’000) | 2015 (Rs. ’000) | ||
| Paid-up ordinary shares/common stock/assigned capital | 24,978,002 | 23,254,605 | ||
| Statutory reserve fund | 5,647,993 | 4,922,367 | ||
| Published retained profits/(accumulated losses) | 1,518,984 | 1,557,331 | ||
| General and other reserves | 44,770,783 | 36,015,294 | ||
| Minority interests (consistent with the above capital constituents) | 823,113 | 50,208 | ||
| Less: Deductions/Adjustments | ||||
| Goodwill | 400,045 | 400,045 | ||
| Other intangible assets | 732,624 | 483,989 | ||
| Advances granted to employees of the Bank for the purchase of shares of the Bank (ESOP) | 302 | 499 | ||
| 50% investments in the capital of other banks and financial institutions | 402 | 402 | ||
| Total eligible core capital (Tier I capital ) | 76,605,502 | 64,914,870 |
2.2 Computation of Total Capital Base (Regulatory Capital)
| As at December 31, | 2016 (Rs. ’000) | 2015 (Rs. ’000) | ||
| Total eligible core capital (Tier I capital) (Refer Note 2.1 above) | 76,605,502 | 64,914,870 | ||
| Supplementary Capital | ||||
| Revaluation reserves (as approved by the Central Bank of Sri Lanka) | 2,034,231 | 2,034,231 | ||
| General provisions | 2,863,408 | 2,351,948 | ||
| Approved subordinated term debt | 24,334,875 | 10,917,767 | ||
| Less: Deductions/Adjustments | ||||
| 50% investments in the capital of other banks and financial institutions | 402 | 402 | ||
| Total capital base | 105,837,614 | 80,218,414 |
3. Computation of Risk-Weighted Assets – RWA
| As at December 31, | 2016 (Rs. ’000) | 2015 (Rs. ’000) | ||
| Credit Risk | ||||
| RWA of On-Balance sheet assets (Refer Note 4.1) | 550,294,881 | 458,837,165 | ||
| RWA of Off-Balance sheet assets (Refer Note 4.2) | 46,103,560 | 39,319,568 | ||
| Total RWA for credit risk (a) | 596,398,441 | 498,156,733 | ||
| Market Risk | ||||
| Capital charge for interest rate risk | 226,153 | 561,648 | ||
| Capital charge for equities | 54,683 | 61,176 | ||
| Capital charge for foreign exchange and gold | 151,979 | 143,204 | ||
| Total capital charge for market risk | 432,815 | 766,028 | ||
| Total RWA for market risk (Total capital charge for market risk x 10) (b) | 4,328,147 | 7,660,279 | ||
| Operational Risk | ||||
| Gross income | ||||
| Year 1 | 35,273,703 | 35,666,060 | ||
| Year 2 | 41,018,522 | 35,273,703 | ||
| Year 3 | 44,346,540 | 41,020,866 | ||
| Average gross income | 40,212,922 | 37,320,210 | ||
| Total capital charge for operational risk – (Average gross income x 15%) | 6,031,938 | 5,598,031 | ||
| Total RWA for operational risk – (Total capital charge for operational risk x 10) (c) | 60,319,383 | 55,980,315 | ||
| Total risk-weighted assets (a + b + c) | 661,045,970 | 561,797,326 |
4. Computation of RWA of On-Balance Sheet and Off-Balance Sheet Assets
4.1 Computation of RWA of On-Balance Sheet Assets
| As at December 31, | 2016 | 2015 | ||||||
| Risk Weight Factor % | On Balance Sheet Assets (Rs. ’000) | Risk Weighted Assets (Rs. ’000) | On Balance Sheet Assets (Rs. ’000) | Risk Weighted Assets (Rs. ’000) | ||||
| Claims on Government of Sri Lanka and Central Bank of Sri Lanka |
0 | 304,463,654 | – | 278,819,777 | – | |||
| Claims on foreign sovereigns and their central banks | 0-150 | 14,828,182 | 14,828,182 | 10,963,272 | 10,963,272 | |||
| Claims on public sector entities (pses) | 20-150 | 8,137 | 8,137 | 2,176,061 | 2,176,061 | |||
| Claims on Banks | 0-150 | 27,620,560 | 16,462,666 | 21,931,045 | 10,693,390 | |||
| Claims on financial institutions | 20-150 | 30,283,774 | 13,081,513 | 32,635,103 | 13,736,419 | |||
| Claims on corporates | 20-150 | 284,911,325 | 277,008,403 | 229,452,108 | 222,334,225 | |||
| Retail claims | 75-100 | 184,180,124 | 153,626,264 | 151,746,375 | 126,561,595 | |||
| Claims secured by residential property | 50-100 | 54,430,398 | 43,784,768 | 43,268,979 | 35,778,552 | |||
| Non-performing assets (npas) | 50-150 | 6,559,370 | 8,820,073 | 7,232,518 | 9,702,823 | |||
| Cash items | 0-20 | 23,958,602 | 1,271,740 | 15,951,475 | 3,907 | |||
| Property, plant & equipment | 100 | 11,675,438 | 11,675,438 | 11,288,672 | 11,288,672 | |||
| Other assets | 100 | 9,727,696 | 9,727,696 | 15,598,248 | 15,598,248 | |||
| Total | 952,647,262 | 550,294,881 | 821,063,634 | 458,837,165 | ||||
4.2 Computation of RWA of Off-Balance Sheet Assets
| As at December 31, | 2016 | 2015 | ||||||
| Credit Conversion Factor % | Principal Amount of Off-Balance Sheet Assets (Rs. ’000) | Risk Weighted Assets (Rs. ’000) | Principal Amount of Off-Balance Sheet Assets (Rs. ’000) | Risk Weighted Assets (Rs. ’000) | ||||
| Claims on Banks | ||||||||
| (a) Foreign exchange contracts | 2 | 176,228,611 | 1,003,151 | 213,383,575 | 1,335,748 | |||
| (I) Original maturity – Less than one year | 176,228,611 | 1,003,151 | 213,383,575 | 1,335,748 | ||||
| Claims on corporates | ||||||||
| (a) Direct credit substitutes | 100 | 21,068,556 | 18,265,104 | 19,525,544 | 16,782,075 | |||
| (i) General guarantees of indebtedness | 21,068,556 | 18,265,104 | 19,525,544 | 16,782,075 | ||||
| (b) Transaction-related contingencies | 50 | 19,742,310 | 9,196,436 | 11,610,441 | 5,600,459 | |||
| (i) Performance bonds, bid bonds and warranties | 19,742,310 | 9,196,436 | 11,610,441 | 5,600,459 | ||||
| (ii) Others | – | – | – | – | ||||
| (c) Short-term self-liquidating trade-related contingencies | 20 | 60,508,393 | 11,846,911 | 54,293,156 | 10,620,306 | |||
| (i) Shipping guarantees | 1,625,728 | 283,712 | 1,755,562 | 336,409 | ||||
| (ii) Documentary letters of credit | 32,920,889 | 6,370,844 | 26,441,578 | 5,064,694 | ||||
| (iii) Trade-related acceptances | 680,739 | 136,148 | 387,284 | 77,457 | ||||
| (iv) Others | 25,281,037 | 5,056,207 | 25,708,732 | 5,141,746 | ||||
| (d) Foreign exchange contracts | 52,429,672 | 688,146 | 32,729,935 | 476,461 | ||||
| (i) Original maturity – Less than one year | 2 | 47,395,225 | 634,094 | 26,286,091 | 411,071 | |||
| (ii) Original maturity – More than one year and less than two years |
5 | 5,034,447 | 54,052 | 6,443,844 | 65,390 | |||
| Retail claims | ||||||||
| (a) Direct credit substitutes | 100 | 6,927,352 | 3,817,954 | 6,163,524 | 3,412,998 | |||
| (i) General guarantees of indebtedness | 6,927,352 | 3,817,954 | 6,163,524 | 3,412,998 | ||||
| (b) Transaction-related contingencies | 50 | 2,810,750 | 762,451 | 2,484,828 | 578,091 | |||
| (i) Performance bonds, bid bonds and warranties | 2,810,750 | 762,451 | 2,484,828 | 578,091 | ||||
| (c) Short-term self-liquidating trade-related contingencies | 20 | 3,427,238 | 523,407 | 3,898,084 | 513,430 | |||
| (i) Shipping guarantees | 125,733 | 16,358 | 178,038 | 28,044 | ||||
| (ii) Documentary letters of credit | 3,301,505 | 507,049 | 3,720,046 | 485,386 | ||||
| (iii) Trade related acceptances | – | – | – | – | ||||
| (iv) Others | – | – | – | – | ||||
| Other commitments with an original maturity of up to one year or which can be unconditionally cancelled at any time |
0 | 116,473,250 | – | 127,288,911 | – | |||
| Undrawn term loans | 29,599,437 | – | 38,435,052 | – | ||||
| Undrawn overdraft facilities/unused credit card lines | 67,613,047 | – | 71,320,764 | – | ||||
| Others | 19,260,766 | – | 17,533,095 | – | ||||
| Total | 459,616,132 | 46,103,560 | 471,377,998 | 39,319,568 | ||||
Table 44
Tables 45 to 50 on pages 409 to 413 depict Basel III Guidelines based disclosures of the Bank.
Readiness with Basel III Regulatory Disclosure Requirements
Key Regulatory Ratios – Capital and Liquidity
| Item | December 31, 2016 Amount (Rs. ’000) | |
| Regulatory Capital (Rs. ’000) | ||
| Common Equity | 67,284,572 | |
| Tier I Capital | 67,284,572 | |
| Total Capital | 96,517,086 | |
| Regulatory Capital Ratios (%) | ||
| Common Equity Tier I Capital Ratio (Minimum Requirement – 4.5% (with effect from 01.07.2017) | 10.60% | |
| Tier I Capital Ratio Minimum Requirement – 7.75% (with effect from 01.07.2017) | 10.60% | |
| Total Capital Ratio Minimum Requirement – 11.75% (with effect from 01.07.2017) | 15.20% | |
| Regulatory Liquidity | ||
| Statutory Liquid Assets (Rs. ’000) | 211,363,134 | |
| Statutory Liquid Assets Ratio (Minimum Requirement – 20% ) | 27.41% | |
| Domestic Banking Unit (%) | 27.19% | |
| Off shore Banking Unit (%) | 30.19% | |
| Liquidity Coverage Ratio (%) – Rupee Minimum Requirement – 80% (with effect from 01.01.2017 ) | 422.96% | |
| Liquidity Coverage Ratio (%) – All Currency Minimum Requirement – 80% (with effect 01.01.2017) | 241.35% |
Table 45 (CBSL Disclosure)
Basel III Computation of Capital Ratios as at December 31, 2016
| Item | Amount (Rs. ’000) | |
| Common Equity Tier I (CET I) Capital after Adjustments | 67,284,572 | |
| Total Common Equity Tier I (CET I) Capital | 69,368,825 | |
| Equity Capital (Stated Capital)/Assigned Capital | 24,977,700 | |
| Reserve fund | 5,647,890 | |
| Published retained earnings/(Accumulated retained losses) | 1,538,142 | |
| Published Accumulated Other Comprehensive Income (OCI) | (6,705,188) | |
| General and other disclosed reserves | 43,910,281 | |
| Unpublished current year’s profit/(losses) and gains reflected in OCI | – | |
| Ordinary shares issued by consolidated banking and financial subsidiaries of the Bank and held by third parties | – | |
| Total Adjustments to CET I Capital | 2,084,253 | |
| Goodwill (net) | ||
| Intangible Assets (net) | 640,646 | |
| Significant investments in the capital of financial institutions where the Bank owns more than 10% of the issued ordinary share capital of the entity |
1,443,607 | |
| Additional Tier I (ATI) Capital after Adjustments | – | |
| Total Additional Tier I (ATI) Capital | – | |
| Qualifying Additional Tier I Capital Instruments | – | |
| Instruments issued by consolidated banking and financial subsidiaries of the Bank and held by third parties | – | |
| Total Adjustments to ATI Capital | – |
| Item | Amount (Rs. ’000) | |
| Investments in own shares | – | |
| Others (Specify) | – | |
| Tier II Capital after Adjustments | 29,232,514 | |
| Total Tier II Capital | 29,232,514 | |
| Qualifying Tier II Capital Instruments | 24,334,875 | |
| Revaluation gains | 2,034,231 | |
| Loan Loss Provisions | 2,863,408 | |
| Instruments issued by Consolidated Banking and Financial Subsidiaries of the Bank and held by Third Parties | – | |
| Total Adjustments to Tier II Capital | – | |
| Investment in own shares | – | |
| Others (Specify) | – | |
| CETI Capital | 67,284,572 | |
| Total Tier I Capital | 67,284,572 | |
| Total Capital | 96,517,086 | |
| Total Risk Weighted Amount | 634,947,824 | |
| Risk Weighted Amount for Credit Risk | 580,193,958 | |
| Risk Weighted Amount for Market Risk | 3,683,529 | |
| Risk Weighted Amount for Operational Risk | 51,070,336 | |
| CETI Capital Ratio (including Capital Conservation Buffer, Countercyclical Capital Buffer & Surchage on D-SIBs) (%) | 10.60% | |
| Of which: Capital Conservation Buffer (%) | – | |
| Of which: Countercyclical Buffer (%) | – | |
| Of which: Capital Surcharge on D-SIBs (%) | – | |
| Total Tier 1 Capital Ratio (%) | 10.60% | |
| Total Capital Ratio (Including Capital Conservation Buffer,Countercyclical Capital Buffer & Surcharge on D-SIBs (%) |
15.20% | |
| Of which: Capital Conservation Buffer (%) | – | |
| Of which: Countercyclical Buffer (%) | – | |
| Of which: Capital Surcharge on D-SIBs (%) | – |
Table 46 (CBSL Disclosure)
The implementation of Basel III computation of capital ratios as per the above format and reporting is effective from July 01, 2017
Basel III Computation of Liquidity Coverage Ratio as at December 31, 2016
| Amount (Rs. ’000) | |||
| Item | Total Unweighted Value | Total weighted Value | |
| Total stock of High Quality Liquid Assets (HQLA) | 139,201,013 | 139,088,165 | |
| Total Adjusted Level 1A Assets | 138,975,487 | 138,975,487 | |
| Level 1A Assets | 138,975,402 | 138,975,402 | |
| Total Adjusted Level 2A Assets | – | – | |
| Level 2A Assets | – | – | |
| Total Adjusted Level 2B Assets | 225,526 | 112,763 | |
| Level 2B Assets | 225,526 | 112,763 | |
| Total Cash outflows | 978,003,918 | 182,394,614 | |
| Deposits | 552,552,387 | 55,255,239 | |
| Unsecured wholesale funding | 208,051,363 | 101,309,555 | |
| Secured funding transactions | – | – | |
| Undrawn portion of committed (irrevocable) facilities and other contingent funding obligations | 217,103,854 | 25,533,505 | |
| Additional requirements | 296,315 | 296,315 | |
| Total Cash Inflows | 205,585,675 | 124,765,753 | |
| Maturing secured lending transactions backed by collateral | 35,782,810 | 35,325,892 | |
| Committed facilities | – | – | |
| Other inflows by counterparty which are maturing within 30 days | 59,398,731 | 38,837,257 | |
| Operational deposits | 9,198,927 | – | |
| Other cash inflows | 101,205,207 | 50,602,604 | |
| Liquidity Coverage Ratio (%) (Stock of High Quality Liquid Assets/Total Net Cash Outflows over the Next 30 Calendar Days)*100 |
241.35% | ||
Table 47 (CBSL Disclosure)
Credit Risk under Standardised Approach
Credit Risk Exposures and Credit Risk Mitigation (CRM) Effects
| Amount (Rs. ’000) as at Decemeber 31, 2016 | |||||||||
| Asset Class | Exposures before Credit Conversion Factor (CCF) and CRM | Exposures post CCF and CRM | RWA and RWA Density (%) | ||||||
| On-Balance Sheet Amount | Off-Balance Sheet Amount | On-Balance Sheet Amount | Off-Balance Sheet Amount | RWA | RWA Density (%) | ||||
| Claims on Central Government and Central Bank of Sri Lanka |
304,394,727 | 63,643,750 | 304,394,727 | 1,272,875 | – | – | |||
| Claims on Foreign Sovereigns and their Central Banks | 12,120,831 | – | 12,120,831 | – | 12,120,831 | 100.00 | |||
| Claims on Public Sector Entities (PSEs) | 8,137 | – | 8,137 | – | 8,137 | 100.00 | |||
| Claims on Official Entities and Multilateral Development Banks (MDBs) |
– | – | – | – | – | – | |||
| Claims on Banks Exposures | 25,083,849 | 112,584,838 | 25,083,849 | 2,251,697 | 14,928,477 | 54.61 | |||
| Claims on Financial Institutions | 30,283,774 | – | 30,283,774 | – | 13,081,513 | 43.20 | |||
| Claims on Corporates | 317,859,443 | 253,702,480 | 281,104,342 | 40,915,599 | 313,198,017 | 97.26 | |||
| Retail Claims | 216,539,136 | 29,685,039 | 185,320,826 | 6,307,048 | 151,197,530 | 78.90 | |||
| Claims Secured by Residential Property | 54,430,398 | – | 54,430,398 | – | 43,784,768 | 80.44 | |||
| Claims Secured by Commercial Real Estate | – | – | – | – | – | – | |||
| Non-Performing Assets (NPAs) | 6,559,370 | – | 6,559,370 | – | 8,820,073 | 134.47 | |||
| Higher-risk Categories | 687,282 | – | 687,282 | – | 1,718,204 | 250.00 | |||
| Cash Items and Other Assets | 43,830,145 | – | 43,830,145 | – | 21,336,408 | 48.68 | |||
| Total | 1,011,797,092 | 459,616,108 | 943,823,682 | 50,747,219 | 580,193,958 | 58.34 | |||
Table 48 (CBSL Disclosure)
Exposures by Asset Classes and Risk-Weights
| Description | Amount (Rs. ’000) as at December 31, 2016 (Post CCF & CRM) | |||||||||
| Risk Weight/Asset Class | 0% | 20% | 50% | 60% | 75% | 100% | 150% | >150% | Total Credit Exposures Amount | |
| Claims on Central Government and Central Bank of Sri Lanka |
305,667,602 | – | – | – | – | – | – | – | 305,667,602 | |
| Claims on Foreign Sovereigns and their Central Banks |
– | – | – | – | – | 12,120,831 | – | – | 12,120,831 | |
| Claims on Public Sector Entities (PSEs) |
– | – | – | – | – | 8,137 | – | – | 8,137 | |
| Claims on Official Entities and Multilateral Development Banks (MDBs) |
– | – | – | – | – | – | – | – | – | |
| Claims on Bank’s Exposures | – | 8,485,842 | 11,236,789 | – | – | 7,612,914 | – | – | 27,335,546 | |
| Claims on Financial Institutions | – | 7,881,716 | 21,793,776 | – | – | 608,282 | – | – | 30,283,774 | |
| Claims on Corporates | – | 7,443,099 | 5,734,891 | – | – | 308,841,951 | – | – | 322,019,941 | |
| Retail Claims | 1,077,309 | 63,393 | – | 50,301,492 | 76,726,893 | 63,458,787 | – | – | 191,627,874 | |
| Claims Secured by Residential Property |
– | – | 21,291,261 | – | – | 33,139,137 | – | – | 54,430,398 | |
| Claims Secured by Commercial Real Estate |
– | – | – | – | – | – | – | – | – | |
| Non-Performing Assets (NPAs) | – | – | 38,157 | – | – | 1,961,651 | 4,559,562 | – | 6,559,370 | |
| Higher-risk Categories | – | – | – | – | – | – | – | 687,282 | 687,282 | |
| Cash Items and Other Assets | 17,406,776 | 6,358,702 | – | – | – | 20,064,668 | – | – | 43,830,145 | |
| Total | 324,151,687 | 30,232,752 | 60,094,875 | 50,301,492 | 76,726,893 | 447,816,358 | 4,559,562 | 687,282 | 994,570,901 | |
Table 49 (CBSL Disclosure)
Computation of Risk Weighted Amount for Operational Risk for the year ended December 31, 2016
| Amount (Rs. ’000) | ||||||||||||
| Business Lines | Capital Charge Factor (Alpha and Beta) | Fixed Factor ‘m’ | Gross Income | Capital Charges | ||||||||
| 1st Year | 2nd Year | 3rd Year | 1st Year | 2nd Year | 3rd Year | |||||||
| The Basic Indicator Approach | 15% | 35,186,169 | 40,771,463 | 44,057,658 | 5,277,925 | 6,115,719 | 6,608,649 | |||||
| The Standardised Approach | 35,186,169 | 40,771,463 | 44,057,658 | 4,523,252 | 5,533,628 | 5,955,485 | ||||||
| Corporate Finance | 18% | – | – | – | – | – | – | |||||
| Trading and Sales | 18% | (910,115) | 3,317,030 | 3,771,864 | (163,821) | 597,065 | 678,936 | |||||
| Payment and Settlement | 18% | 395,330 | 437,001 | 511,789 | 71,159 | 78,660 | 92,122 | |||||
| Agency Services | 15% | – | – | – | – | – | – | |||||
| Asset Management | 12% | – | – | – | – | – | – | |||||
| Retail Brokerage | 12% | – | – | – | – | – | – | |||||
| Retail Banking | 12% | 24,640,996 | 23,157,077 | 26,055,771 | 2,956,920 | 2,778,849 | 3,126,693 | |||||
| Commercial Banking | 15% | 11,059,958 | 13,860,355 | 13,718,234 | 1,658,994 | 2,079,053 | 2,057,735 | |||||
| The Alternative Standardised Approach | 386,452,159 | 486,032,975 | 585,368,915 | 1,723,987 | 2,934,930 | 3,491,483 | ||||||
| Subtotal | (514,785) | 3,754,031 | 4,283,653 | (92,661) | 675,726 | 771,058 | ||||||
| Corporate Finance | 18% | – | – | – | – | – | – | |||||
| Trading and Sales | 18% | (910,115) | 3,317,030 | 3,771,864 | (163,821) | 597,065 | 678,936 | |||||
| Payment and Settlement | 18% | 395,330 | 437,001 | 511,789 | 71,159 | 78,660 | 92,122 | |||||
| Agency Services | 15% | – | – | – | – | – | – | |||||
| Asset Management | 12% | – | – | – | – | – | – | |||||
| Retail Brokerage | 12% | – | – | – | – | – | – | |||||
| Subtotal | 386,966,944 | 482,278,944 | 581,085,261 | 1,816,648 | 2,259,204 | 2,720,426 | ||||||
| Retail Banking | 12% | 0.035 | 204,693,529 | 259,771,405 | 314,544,873 | 859,713 | 1,091,040 | 1,321,088 | ||||
| Commercial Banking | 15% | 0.035 | 182,273,416 | 222,507,539 | 266,540,388 | 956,935 | 1,168,165 | 1,399,337 | ||||
| Capital Charges for Operational Risk | 6,000,765 | |||||||||||
| The Basic Indicator Approach | 6,000,765 | |||||||||||
| The Standardised Approach | 5,337,455 | |||||||||||
| The Alternative Standardised Approach | 2,716,800 | |||||||||||
| Risk-Weighted Amount for Operational Risk |
51,070,336 | |||||||||||
| The Basic Indicator Approach | 51,070,336 | |||||||||||
| The Standardised Approach | 45,425,149 | |||||||||||
| The Alternative Standardised Approach | 23,121,702 | |||||||||||
Table 50